Distributed solar, which can be owned by individuals, small businesses, and public entities, is turning the electricity industry upside down as individuals choose to generate their own solar power on their rooftop or through participation in community solar.
In 2024, of the 32 new gigawatts of solar capacity installed, 17% (5.4 GW) was distributed throughout communities.
Many individuals who cannot go solar themselves can subscribe to a community solar garden. These solar arrays offer the same electric bill stability and savings as rooftop solar, but operate remotely under a subscription model.
State Distributed Solar Saturation
The map below illustrates the saturation of each state’s distributed (non-utility-scale) solar market, relative to state population, at the end of 2024.
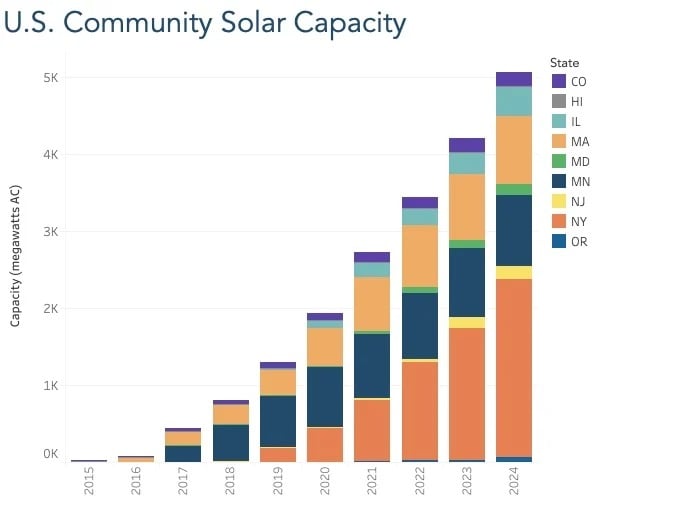
Our analysis combines community solar capacity data in Colorado, Hawai’i, Illinois, Maryland, Massachusetts, Minnesota, New Jersey, New York, and Oregon with the U.S. Energy Information Administration’s figures on small-scale photovoltaic capacity by state. We then use state population estimates to calculate distributed solar per capita (watts per person). The U.S. EIA did not provide data on Alabama.
In 23 states and the District of Columbia, approximately one in every 25 households now has rooftop solar (a state distributed solar saturation of more than 100 watts per capita). This is two more states than in 2023.
Analysis assumes the national average of 2.6 persons per household and 6.5 kilowatt rooftop solar system.
These states’ distributed solar landscapes changed the most since our 2023 update:
Installed distributed solar capacity in California grew by more than a gigawatt in 2024 (1.15 GW); New York was not far behind at 0.94 GW.
Maine (44%), Arkansas (37%), Oregon (35%), Montana (35%), and South Dakota (32%) increased their distributed solar capacity by more than 30% over 2023 levels.
In New Hampshire and Arkansas, all solar growth in 2024 was distributed solar. In Massachusetts and Montana, over 90% of solar growth was distributed.
Community Solar is Gaining Momentum
State policies like community solar support local decision-making and promote the adoption of distributed solar. Additional essential policies include net metering, simplified interconnection rules, and a renewable portfolio standard carve-out for distributed energy. We track these policies and others in our Community Power Map.
Minnesota retained its community solar leadership, boasting more than 150 watts of distributed solar per person. This is the equivalent of more than three out of every 50 households having rooftop solar.
In Minnesota, almost half (47%) of existing solar at the end of 2024 was community solar. New York (39%) and Massachusetts (20%) were also in double digits.
In New York, Oregon, and New Jersey, community solar grew as a percentage of each state’s total solar marketplace.
Oregon more than doubled its community solar capacity, and in Illinois it grew by more than 50%.
The graph below demonstrates the growth in community solar capacity through the end of 2024. You can learn more about which states are leading the charge in community solar through ILSR’s Community Solar Tracker.
State Solar Capacity Summary
The table below provides a summary of all state solar capacity at both distributed and utility scales. To sort the data, click on any column heading.
In 2024, Arizona (1.8 GW) joined California (39.4 GW), Texas (25.4 GW), Florida (13.8 GW) and North Carolina (7.3 GW) as the top five solar capacity states.
But Hawai’i,Maine, Massachusetts, California and Arizona have the greatest distributed solar saturation, as measured by installed distributed solar capacity per person.
Massachusetts, California, Arizona, Nevada, New York all land in the top ten for both total solar capacity and distributed solar saturation.
The map below illustrates total statewide solar capacity – including distributed, community, and utility-scale solar.
ILSR’s State(s) of Distributed Solar analysis is updated annually. For a historical snapshot, explore our archived analyses of distributed solar by state in 2023, 2022, 2021, 2020, 2019, 2018, 2017, and 2016.