
2017 Year-End Update
Energy production from renewable sources continues to expand in the U.S. at a rapid clip, thanks in no small part to the substantial growth of solar energy—and distributed solar in particular—in recent years. More states than ever are making solar a priority. But where have these gains been greatest, and what are the economic implications for residents from one state to the next?
States with policies supporting a larger proportion of distributed energy from small-scale, often locally owned solar, give their residents and businesses big energy savings and their local economies an economic boost, more so than when solar investments are left to incumbent, often investor-owned utilities.
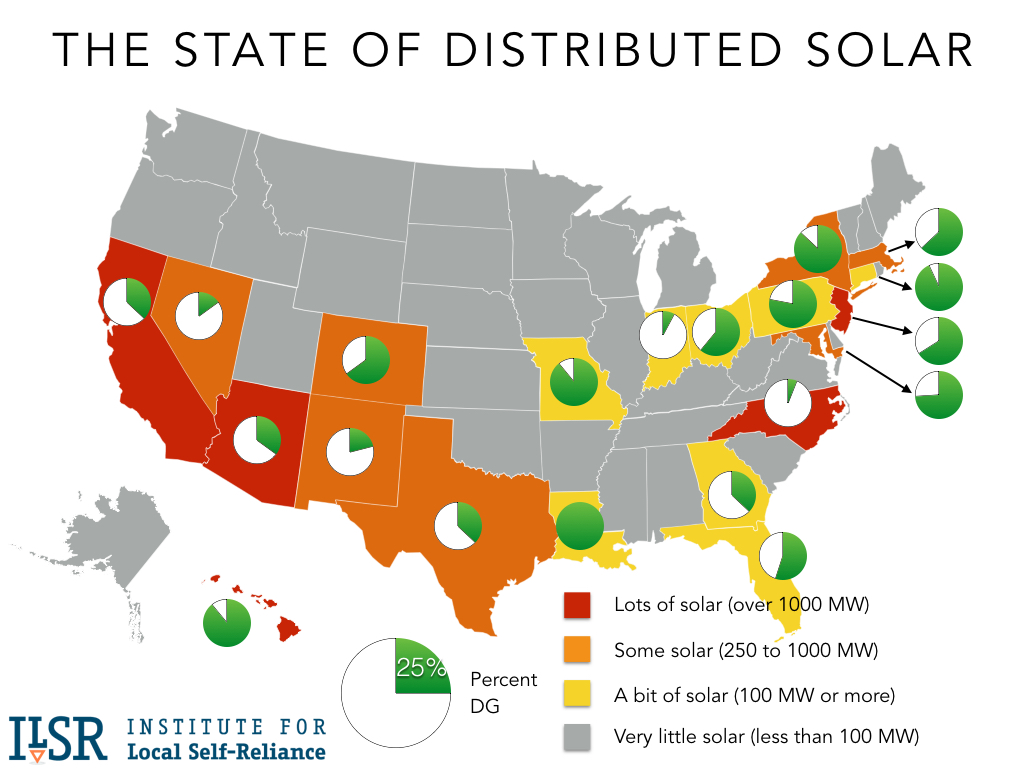
An updated map of the size of each state’s solar market (in yellow, orange, and red) and pie charts showing the corresponding share of distributed solar (1 megawatt and smaller) illustrates how this state-by-state landscape has changed since our original analysis published in 2016.
Total Solar and Percent Distributed by State – 2017

A majority of states—32 to be exact—now boast at least 100 megawatts of solar power in their energy mix, up from only 20 states two years ago. Even with this expansion, similar regional patterns in the state-by-state landscape remain:
- In the Southwest and along the west coast, abundant sunshine and availability of space continue to deploy large amounts of utility-scale solar in states including Nevada, New Mexico, and Texas, while other states in the region including California, Oregon, and Arizona, have had greater success in balancing that utility-scale growth with distributed solar.
- In the Southeast and along the Gulf Coast in states including Alabama, Florida, and Georgia, lackluster growth in total solar has continued despite readily available sunshine, as incumbent monopoly utilities continue to hinder its development. Few states in this region have large solar markets, with the exception of North Carolina, where utility-scale solar dominates as a result of long-term contracts the state’s monopoly utility Duke Energy has made with third party solar developers, who have been able to offer competitive prices to the utility but are not currently authorized to sell electricity directly to customers.
- In the Northeast, Mid-Atlantic, and to a lesser extent the Midwest, many states have seen relatively strong growth in their solar markets and, as a whole, larger than average shares of distributed generation than other regions. Growth has occurred in these regions, despite comparably less sunshine than the country’s sunbelt.
Of the nine states that each contribute more than 1,000 megawatts of solar power, three boast shares of distributed generation greater than 50 percent and all three happen to cluster in the Northeast: New Jersey (1,926 megawatts of total solar, with 66 percent from small-scale sources), Massachusetts (1,810 megawatts, also with 66 percent from small-scale), and New York (1,135 megawatts of total solar), where a whopping 87 percent of total solar has been invested in small-scale, distributed sources.
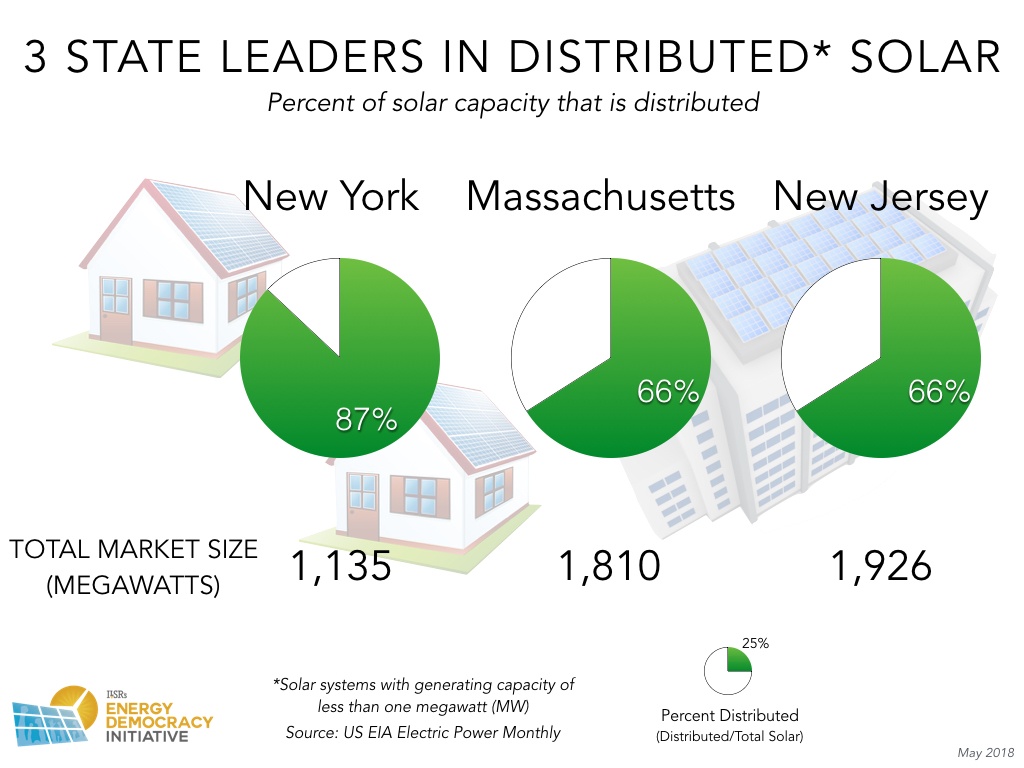
When one accounts for the mix of state-level policies that help or hinder distributed solar, factors underlying these statistics become even clearer. In recent years, New Jersey, Mass., and New York, the three leaders in distributed solar, have each expanded policies, such as net metering and power purchase agreements, that are favorable to distributed generation, while keeping attacks from their incumbent, monopoly utilities at bay.
Even in states that have not yet claimed a majority of solar power from distributed sources, there are still examples of important policy shifts that can increase the rate of growth in distributed generation moving forward. For example, in California, the nation’s leader in solar power capacity (with nearly 16,000 megawatts, 41 percent of which from small-scale sources), recently passed a landmark solar homes rule that will couple distributed solar with all new home construction, when it takes effect in early 2020. Meanwhile, Minnesota has pursued a different tactic to keeping generation local, broadening access to solar energy beyond those who own homes through the nation’s leading community solar program.
Over time, these and other state policy strategies that prioritize distributed generation in their solar and energy markets will work to the benefit of residents, particularly as small-scale solar pays off and brings more substantial local benefits than its utility-scale alternative.
Original Post — 2015 Year-End Update
BY NICK STUMO-LANGER | DATE: 29 FEB 2016
With the solar energy tax credit’s future settled by Congress, solar energy has the green light to continue expanding across the U.S. But who benefits from solar depends heavily on state policy. Do states encourage distributed solar deployment and the democratization of energy or simply leave solar growth up to incumbent utilities?
The inset map illustrates the size of state’s solar market (in yellow, orange, and red) with a pie chart showing the percentage of distributed solar (1 megawatt and smaller) based on 2015 data.
States seem to fall into three categories:
- In the Southwest, abundant sunshine has driven utility-scale solar deployment even as state policy has (until recently) encouraged distributed solar development as well.
- In the Southeast, strong sunshine hasn’t meant much solar because incumbent monopoly utilities have stalled it development. Hence, few Southeastern states have large solar markets, and the one exception (North Carolina) is dominated by utility-scale solar owned by Duke Energy.
- In the Northeast, high electricity prices and robust distributed solar policies have led to strong solar markets and lots of distributed generation, even with modest sunshine (which has also meant less utility-scale solar development).
The focus on the size of solar is important because solar is inherently the most distributed renewable energy resource. Sunshine falls everywhere, and solar can be economically harnessed at nearly any scale. Distributed solar has particular benefits to the electric grid that large-scale solar does not, from lower energy losses by avoiding long-distance power transmission to reducing variability of solar (passing clouds rarely cover entire states, for example). Many states are starting to examine the true value of distributed solar like Minnesota has done.
But beyond the economic benefits, solar also enables a transition from energy monopoly to energy democracy. When electric customers become producers, they also become decision makers in the grid system. As the grid transforms (as with New York’s Reforming the Energy Vision process), these customers will be able to transact with one another and the grid to make it more innovative and efficient). With the coming of economical distributed energy storage, customers may hold the keys to the future of the grid.
Customers may be able to hold the keys, but only if states require the incumbent monopoly to relinquish them. As we can see in the five states from the above map where installed capacity exceeds 1,000 megawatts, policy matters. In four of them (Arizona, California, Hawaii, and New Jersey), policies protecting local authority and encouraging individual ownership of PV arrays have created an environment amenable to greater distributed generation throughout the United States.
- Arizona – 35% Distributed Generation
- While the state of Arizona’s Renewable Portfolio Standard is only 15% by 2025, their solar carve-out (the requirement that electric utilities generate power from the sun with “stiff penalties for non-compliance”) is one of the best in the nation. It sets aside 30% for distributed generation, and half of that for residential installations.
- Arizona gives a sales tax exemption for solar panel purchases, along with half of the other states.
- California – 37% Distributed Generation
- California has been out front on the issue of local, renewable energy for most of the 21st century including breaking down the barriers to distributed generation.
- The state’s 10-year California Solar Initiative providing incentives for distributed solar for years, declining as the costs of solar dropped.
- The state Public Utilities Commission has recently maintained net metering.
- The state’s Energy Commission’s New Solar Homes Partnership offers incentives encouraging energy efficient solar installations in new residential construction including extending a tax break for property taxes.
- The legislature and governor’s office have also required all energy distributors in the state to attain at least “33 percent of their load with renewable energy by 2020” or their Renewable Portfolio Standard.
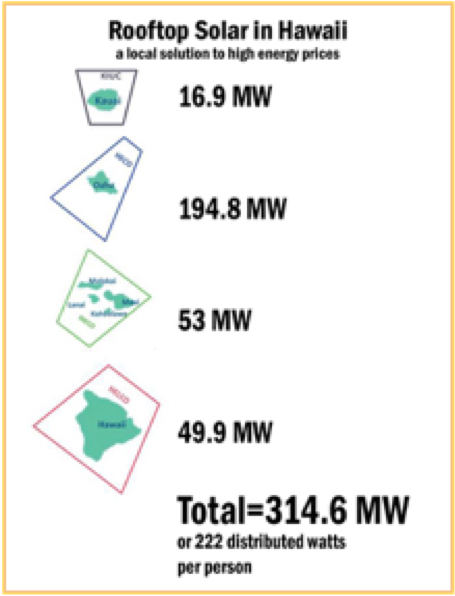
- Hawaii – 89% Distributed Generation
- Currently, 20% of electricity sold in Hawaii comes from renewable resources on the islands thanks in part to the federal solar taxes and nearly half of a million in state tax credits.
- Hawaii’s Renewable Portfolio Standard is among the best in the nation, 100% by 2045, signaling the state government’s commitment to solar and other renewables.
- There are, currently, 314.6 megawatts of rooftop solar installed in Hawaii, and over 15% of households have solar installed. Even more stunning, that’s 222 distributed watts per resident.
- New Jersey – 66% Distributed Generation
- With a Renewable Portfolio Standard of 22.5% by 2021 and a solar carve out of 4.1%, New Jersey has one of the strongest electric utility requirements in the country.
- New Jersey’s net metering law ensures that their residents will get “full retail credit” on their utility bill thanks to solar energy produced by their residential arrays.
- North Carolina – 6% Distributed Generation
- North Carolina has a 12.5% renewable energy standard, with 0.2% set aside for solar that’s nearly fulfilled
- The state offered tax incentives that expired at the end of 2015, and utilities have reduced their distributed solar incentives.
A record 7.3 gigawatts of new solar arrays were installed in 2015. Although the majority of new installed capacity came from utility-owned arrays, residential rooftop solar grew 66% last year (with per 2 gigawatts installed) and distributed commercial solar also continued to grow. But many utilities are frightened of a future with more customer choice and control and are fighting back. They’re rolling back net metering laws in Nevada and adding fees to reduce the financial benefit of solar in Arizona.
Is the future energy monopoly or energy democracy? The states may decide.
This article originally posted at ilsr.org. For timely updates, follow John Farrell or Marie Donahue on Twitter or get the Energy Democracy weekly update. Also check out over 50 episodes of the Local Energy Rules podcast!
