The U.S. electricity sector is evolving toward a clean, decentralized system at an ever-accelerating pace. In 2021, developers installed a record 18.2 gigawatts of solar generation capacity. Out of that total, 5.4 gigawatts came from distributed solar, including a record 500,000 homeowners who installed residential solar systems. Distributed solar, which can be owned by individuals, businesses, and public entities, is turning the electricity industry upside down as individuals choose to generate their own solar power.
Many who could not go solar in 2021 subscribed to a community solar garden. These gardens offer the same electric bill stability and savings as rooftop solar, but operate remotely under a subscription model. The state of New Mexico set up its community solar program last year, joining the 19 states (and the District of Columbia) that offer community solar. Delaware, Oregon, and Virginia all set or improved their rules for community solar in 2021.
See our infographic on how Tweaking a Tax Credit Would Help More Americans Go Solar.
The map below illustrates the saturation of each state’s distributed (non-utility-scale) solar market, relative to population, at the end of 2021. For the purposes of the map, community solar in Colorado, Massachusetts, Minnesota, and New York is included as distributed solar. We added our own figures on state community solar capacity to the U.S. Energy Information Administration’s figures on small-scale photovoltaic capacity by state. This sum was divided by state population estimates from the U.S. Census Bureau, resulting in a figure for distributed solar per capita (watts per person). The U.S. EIA does not collect data for Alabama or Georgia.
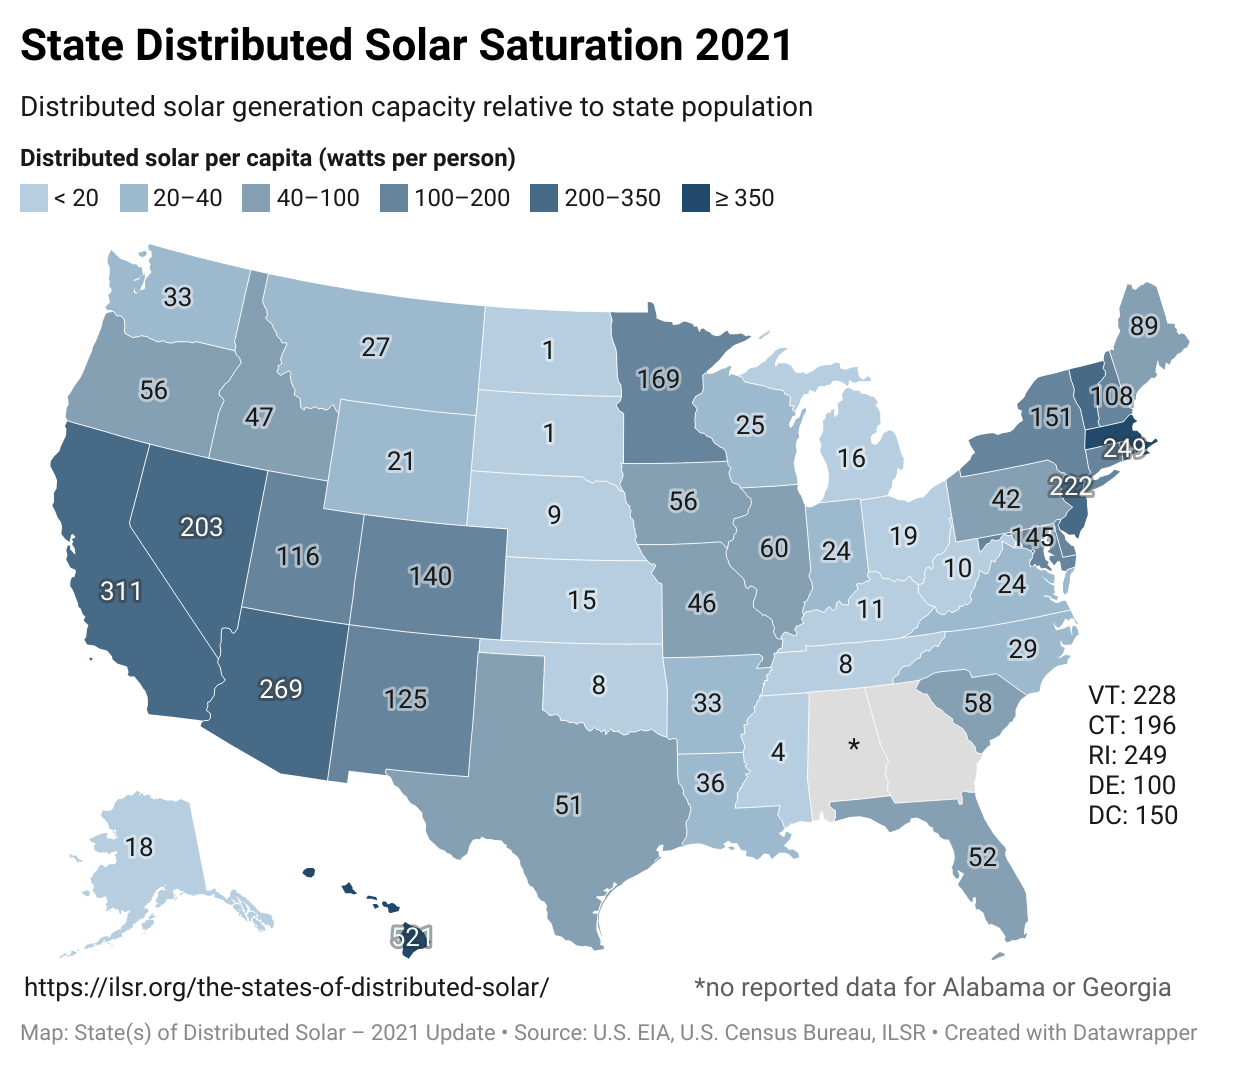
Seventeen states and the District of Columbia have a distributed solar saturation of more than 100 watts per capita.
When solar-enabling policies are in place, how well do utilities follow the rules? Read our report on How Electric Utilities and Policymakers Are Holding Back Local Solar.
20 watts per capita is equivalent to rooftop solar on 1 out of every 125 households; 40 watts per capita is equivalent to 2 out of every 125 households; 100 watts per capita is equivalent to 1 out of every 25 households; 200 watts per capita is equivalent to 2 out of every 25 households; 300 watts per capita is equivalent to 3 out of every 25 households; and Hawaii has the equivalent of rooftop solar on 1 out of every 5 households (given the national average of 2.6 persons per household and 6.5 kilowatt rooftop solar systems).
Here are the top states in order from most distributed solar per capita to least:
- Hawaii: 521 watts per capita (750 megawatts of distributed solar)
- Massachusetts 363 watts per capita (2,532 megawatts of distributed solar)
- California: 311 watts per capita (12,200 megawatts of distributed solar)
- Arizona: 269 watts per capita (1,956 megawatts of distributed solar)
- Rhode Island: 249 watts per capita (272 megawatts of distributed solar)
- Vermont: 228 watts per capita (147 megawatts of distributed solar)
- New Jersey: 222 watts per capita (2,057 megawatts of distributed solar)
- Nevada: 203 watts per capita (637 megawatts of distributed solar)
- Connecticut: 196 watts per capita (708 megawatts of distributed solar)
- Minnesota: 169 watts per capita (966 megawatts of distributed solar)
- New York: 151 watts per capita (3,005 megawatts of distributed solar)
- Washington D.C.: 150 watts per capita (101 megawatts of distributed solar)
- Maryland: 145 watts per capita (897 megawatts of distributed solar)
- Colorado: 140 watts per capita (814 megawatts of distributed solar)
- New Mexico: 125 watts per capita (264 megawatts of distributed solar)
- Utah: 116 watts per capita (387 megawatts of distributed solar)
- New Hampshire: 108 watts per capita (150 megawatts of distributed solar)
- Delaware: 100 watts per capita (101 megawatts of distributed solar)
Although California, Texas, Florida, and North Carolina have the largest overall solar markets (see below), Hawaii, Massachusetts, California, and Arizona have the greatest distributed solar saturation, as measured in installed distributed solar capacity per capita. California, Arizona, Nevada, Massachusetts, and New Jersey all land in the top ten for both distributed solar saturation and total solar generation capacity.
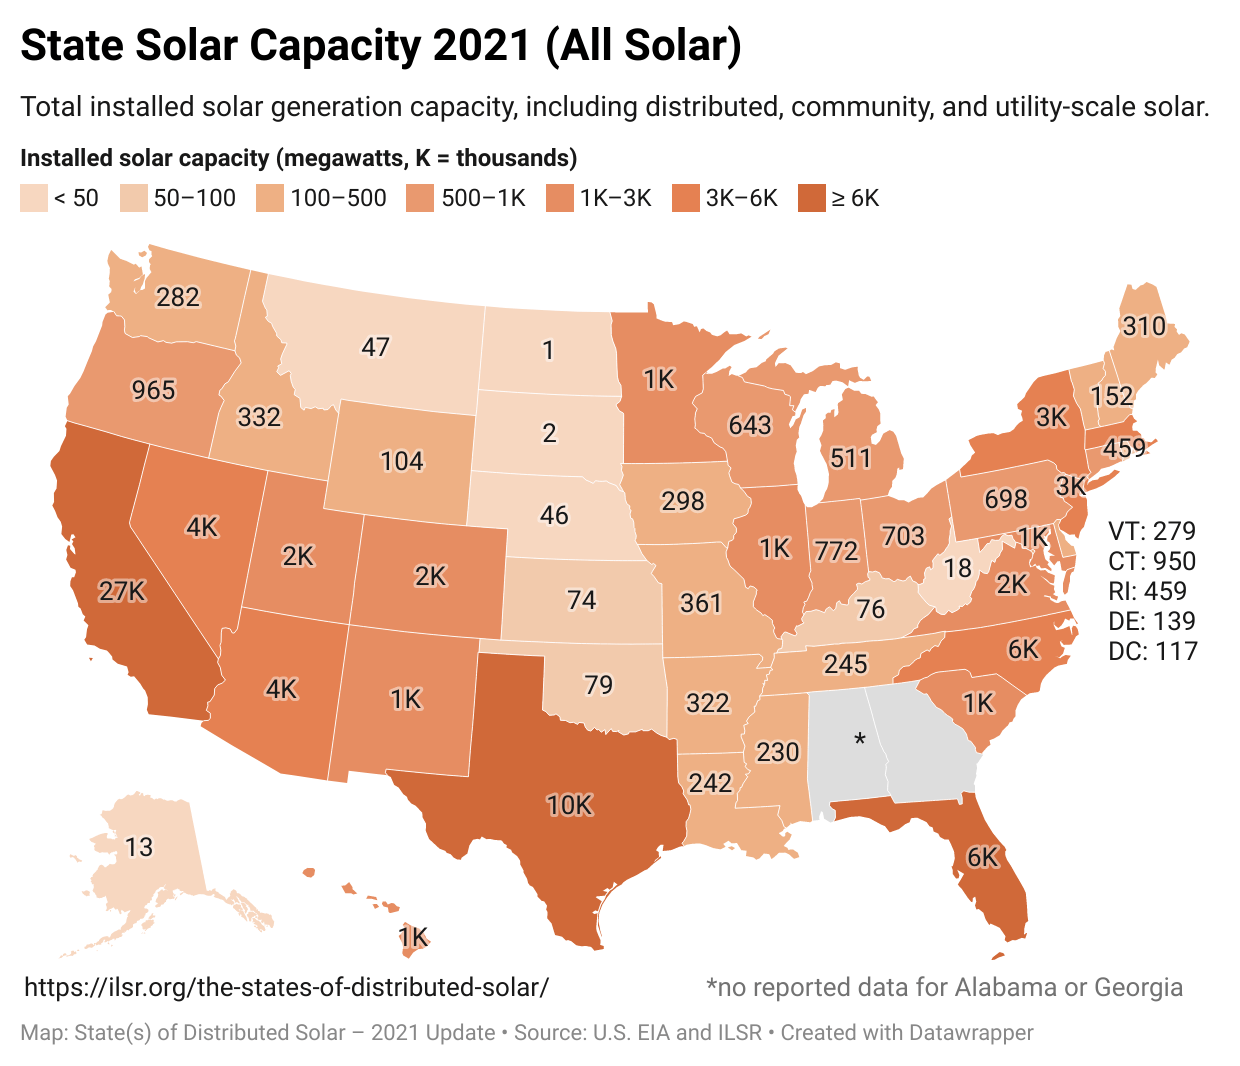
These state solar markets changed the most since our 2020 update:
- Installed solar capacity in Texas, California, and Florida all grew by more than a gigawatt in 2021 (4.3, 3.0, and 1.5 gigawatts, respectively). Virginia’s installed solar capacity grew by just under one gigawatt (955 megawatts).
- Maine, Ohio, Illinois, and Wisconsin doubled or more than doubled their installed solar capacity with growth from 2021.
- Indiana, Iowa, Colorado, and Michigan also saw rapid solar generation capacity expansion in 2021 (91%, 80%, 55%, and 53%, respectively).
Eighteen states can now claim more than 1,000 megawatts of total solar capacity and 40 have more than 100 megawatts.
For more analysis on the growth of the U.S. power sector, read our latest quarterly update.
Community solar, enabled in 20 states and the District of Columbia, brings many of the benefits of power to those who have traditionally been left out. Community solar gardens — which are larger than residential solar installations, but smaller than utility-owned solar fields — are the most cost-effective size for solar and reduce electric bills for members of the community.
The following graphic highlights the four community solar-enabling states — Colorado, Massachusetts, Minnesota, and New York — that we are able to track at this time. The figures for community solar saturation are calculated by dividing installed community solar capacity by state population.
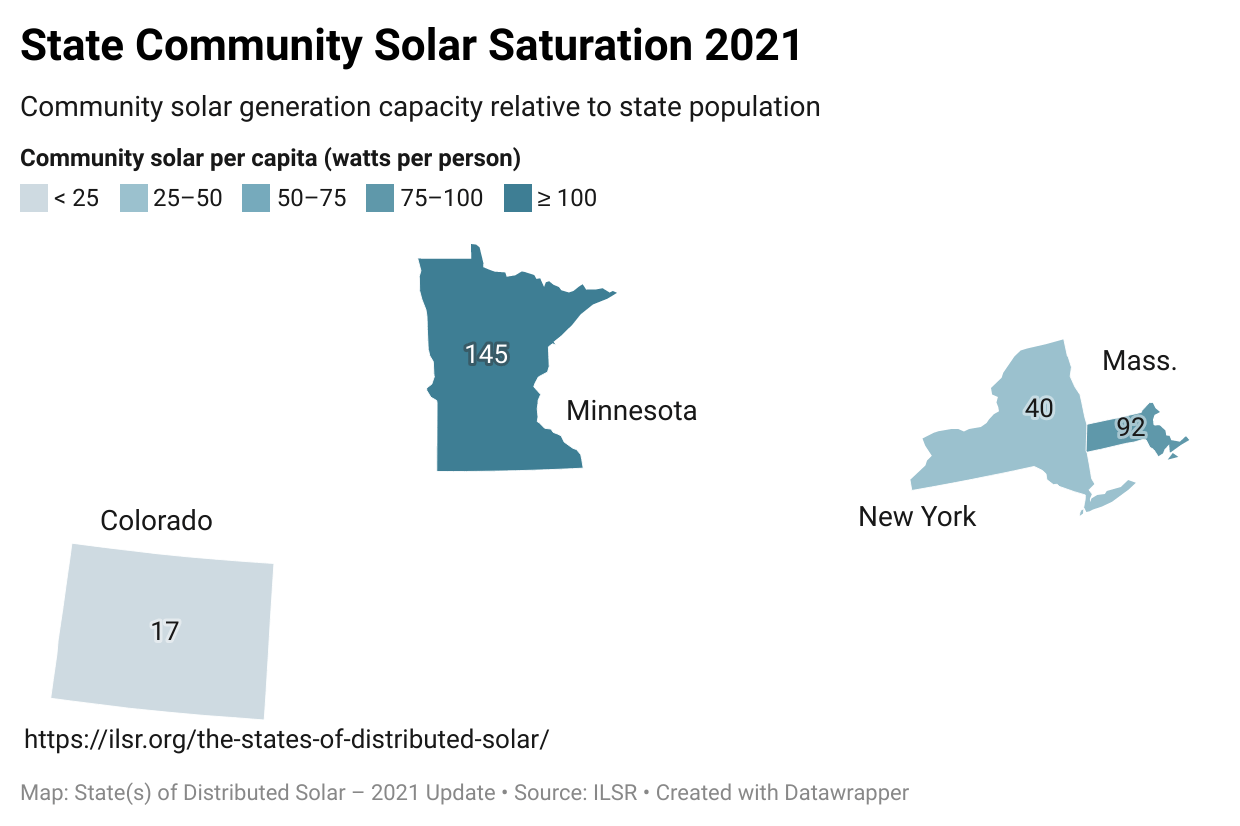
Total installed community solar capacity at the end of 2021:
- Minnesota (826 megawatts)
- New York (799 megawatts)
- Massachusetts (641 megawatts)
- Colorado (96 megawatts)
State policies like community solar are crucial in support of local decision-making and promoting the adoption of distributed solar. Additional essential policies include net metering, simplified interconnection rules, property assessed clean energy, a renewable portfolio standard carve-out for solar or distributed energy, and solar or solar-ready mandates for buildings. We track these policies and others in our Community Power Map.
ILSR’s State(s) of Distributed Solar analysis is updated annually. For a historical snapshot, explore our archived analyses of distributed solar by state in 2020, 2019, 2018, 2017, and 2016.
This article originally posted at ilsr.org. For timely updates, follow John Farrell on Twitter or get the Energy Democracy weekly update.


