
Each year, the Energy Democracy Initiative at the Institute for Local Self-Reliance tracks and scores states based on their energy policies and how these policies help or hinder local clean energy action.
Click here for our updated 2020 Community Power Scorecard
In the 2019 Community Power Scorecard, four states excelled, 11 states and the District of Columbia saw above average scores, 15 were mediocre, and 20 states received failing grades at enabling individuals and communities to take charge of their energy futures.
Click or scroll down to view and share infographics of the latest Scorecard and state scores — including a list of the Top 5 and Bottom 5 states.
Details about our scoring methodology are available in this archive. In addition to synthesizing information available from national resources provided by clean energy and policy groups such as DSIRE, Interstate Renewable Energy Council, and the National Conference of State Legislatures, we continue to track coverage of notable actions taken by legislatures and utility commissions that impact how communities can participate in decision-making in the energy system.
This year, we included two major improvements to our method.
First, we adjusted grades for how customer-friendly states’ net metering environments are, using data from SolarPowerRocks. Earlier resources used to compare state net metering policies had not been sufficiently updated in time for our analysis.
In addition, we also adjusted the way we scored state policies enabling community or shared renewable programs to give greater weight to these important efforts that increase access to distributed energy. We created a new rubric to evaluate existing policies and programs, giving credit to states with enabling policy and fully-fledged programs that include multiple utilities, meaningfully address access by low-income households, have more than 100 Megawatts of capacity online, and allow for multiple technologies (e.g., solar, wind, digesters). In doing so, we increased the number of available points in this category by two. As a result, a total of 38 points are available across all categories used in our 2019 Scorecard.
Read more about Why ILSR’s 2019 Community Power Scorecard Matters in our companion commentary about this year’s analysis.
Last year’s scores are available in our 2018 Scorecard, and a detailed comparison between the 2018 and 2017 scorecards illustrates how scores changed between those years. New comparisons of how states scored regionally and how their ranking changed between 2019 and 2018 are also now available (as of March 2019).
Community Power Scorecard — National Map

Community Power Scorecard — State-by-State Scores
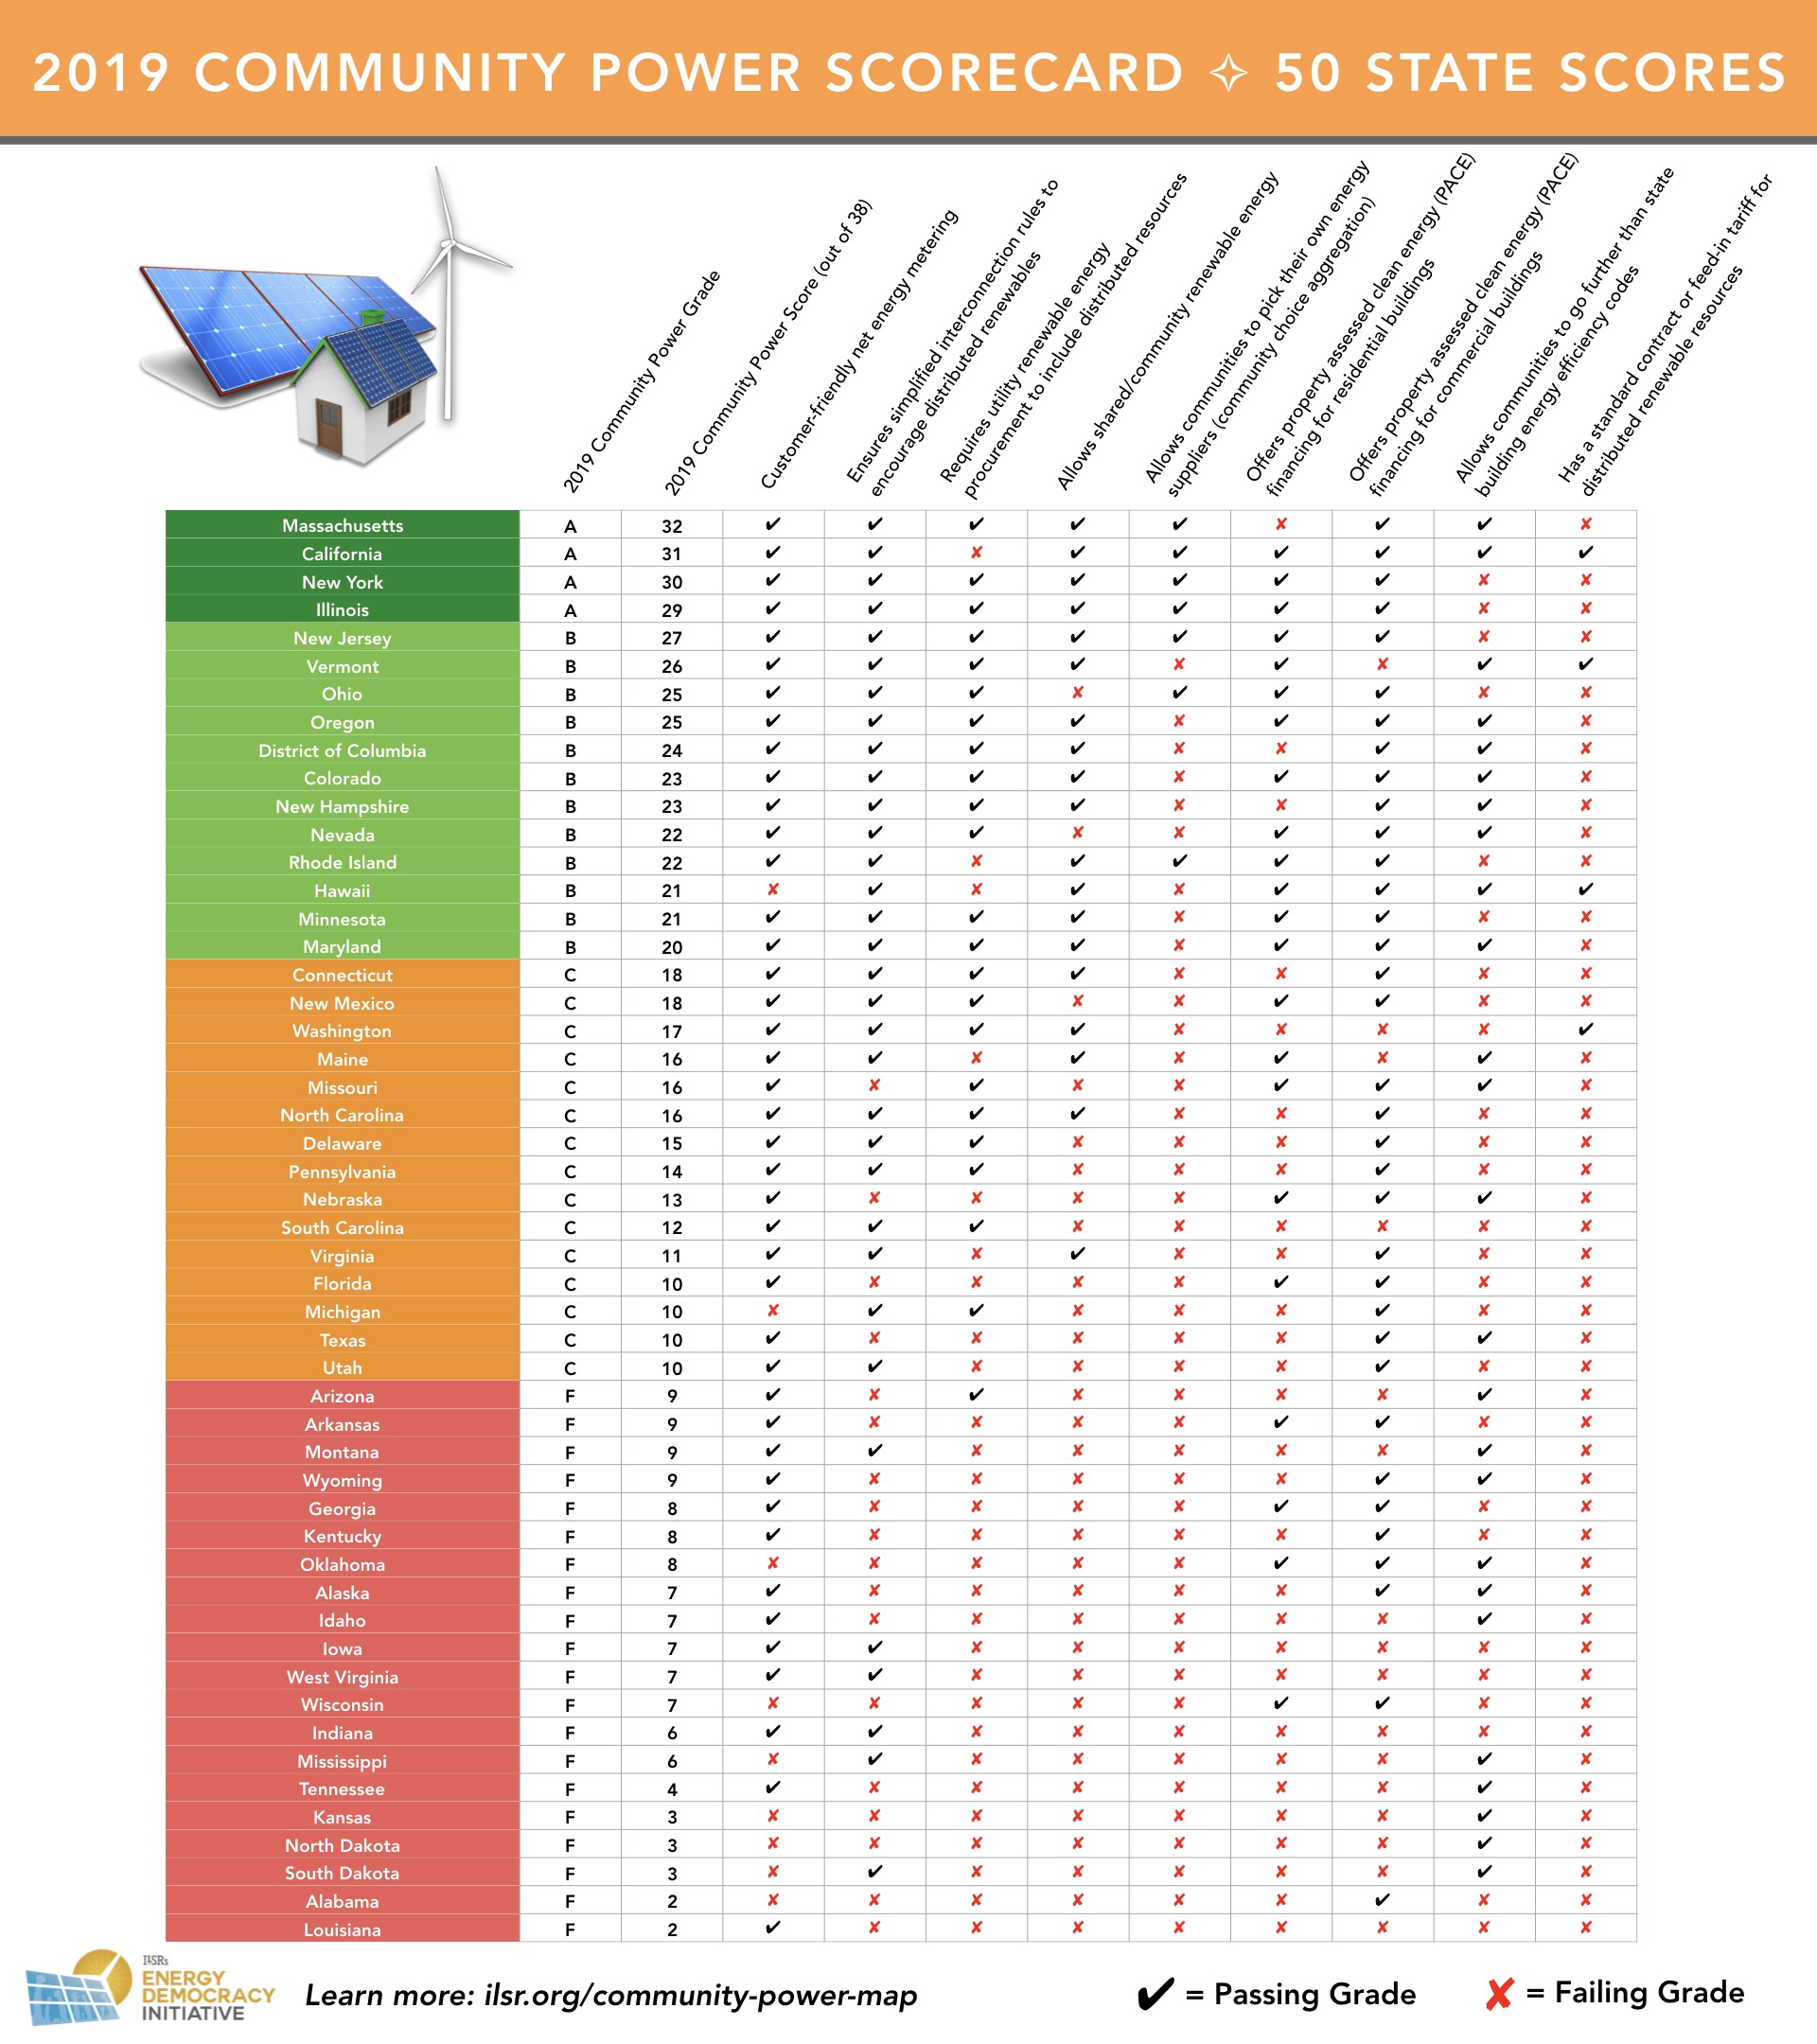
The full scorecard above shows the nine individual policies and programs that help states can use to enable local clean energy action (see additional details on methodology by exploring our interactive Community Power Map).
For each factor, passing grades (represented by a black checkmark) correspond to whether or not the state has an enabling policy and, in some cases, the quality of its policy or program (we consider individual policy grades of C or above to be passing). Conversely, mediocre and failing grades, illustrated by a red X, mean the state does not have that particular policy — or that its policy does not sufficiently support local clean energy.
Correction: The 2019 Community Power Scorecard table, above, was updated in April 2019 to correct an error in the original concerning Virginia’s statewide building energy code standard. State policy in Virginia does not fall into the definition of a “stretch code,” and the state does not currently allow for statewide requirements to be “altered by local jurisdictions,” which we had incorrectly reported in the state’s original score. As a result, Virginia’s final, corrected score is 11 points. Even with this adjustment, Virginia receives a “C” letter grade.
The Top 5 States
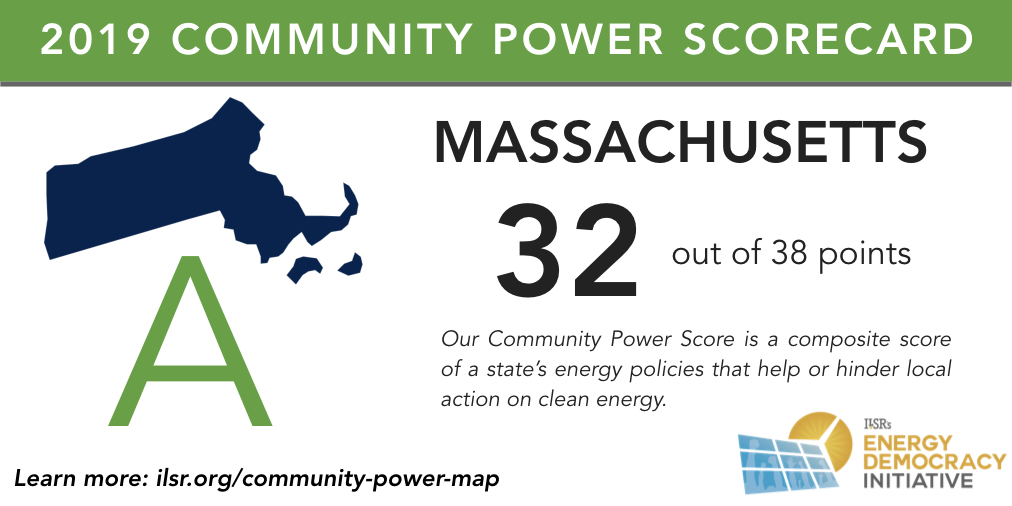
Massachusetts has a Community Power score of 32 out of 38. The state has many policies encouraging local power, including net metering and simplified interconnection to encourage distributed energy resources like solar, as well as requiring utility renewable energy procurement to include distributed resources. It also allows shared or community renewable energy, communities to pick their energy suppliers, and allows communities to provide financing to commercial properties with property assessed clean energy. Massachusetts also has a state building energy code with a standard “stretch” code for communities to go further than the state standard. The state only lacks a standard contract for distributed renewable energy projects and residential PACE.
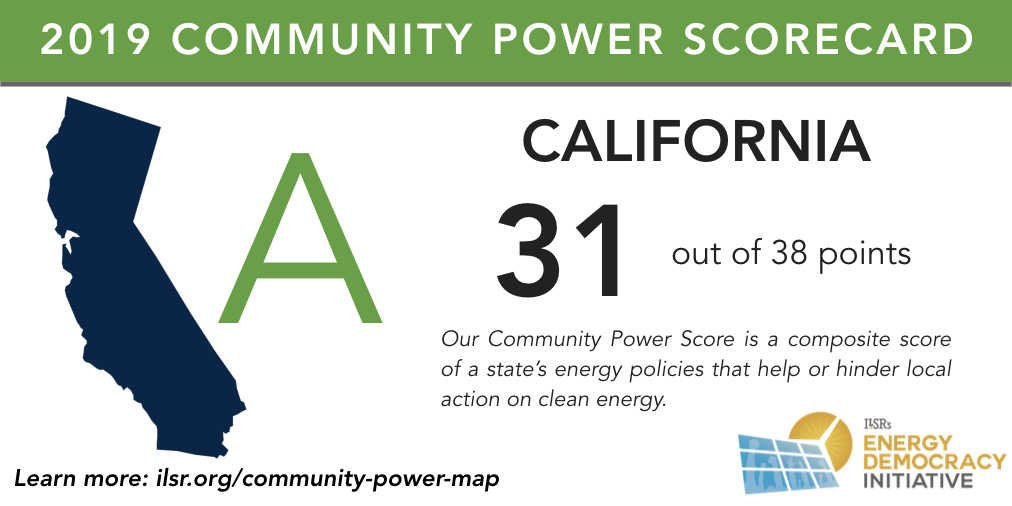
California has a Community Power score of 31 out of 38. The state has many policies encouraging local power, including net metering and simplified interconnection to encourage distributed energy resources like solar. It also allows shared or community renewable energy, communities to pick their energy suppliers, and allows communities to provide financing to residential and commercial properties with property assessed clean energy. California is one of a few states to provide a standard offer contract or feed-in tariff to help finance distributed energy across the state. The state lags in requiring utility renewable energy procurement to include distributed resources, and its shared renewables program could be improved.
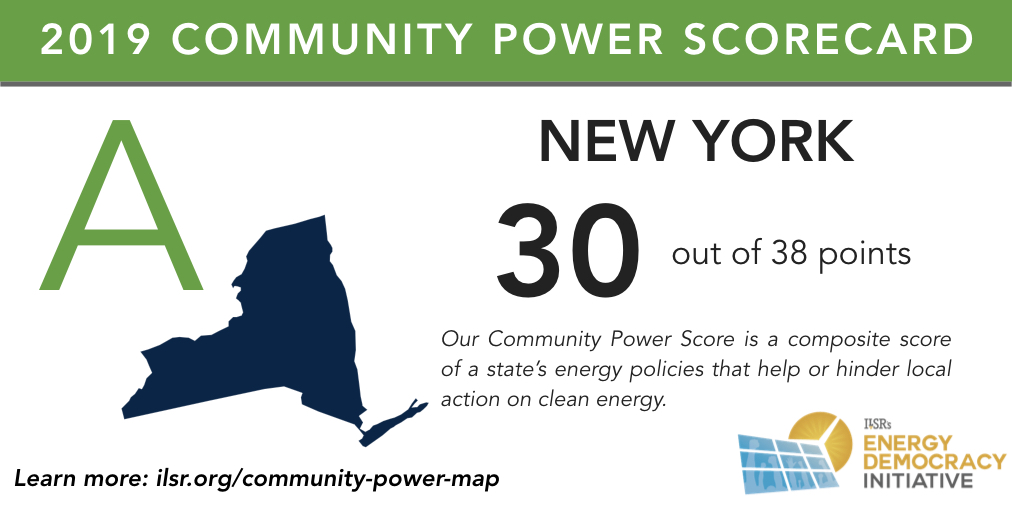
New York has a Community Power score of 29 out of 36. The state has many policies encouraging local power, including net metering and simplified interconnection to encourage distributed energy resources like solar, as well as requiring utility renewable energy procurement to include distributed resources. It also allows shared/community renewable energy, communities to pick their energy suppliers, and allows communities to provide financing to residential and commercial properties with property assessed clean energy. The state lacks a standard contract for distributed renewable energy projects and a stretch building energy code for cities to go further than the state standard.
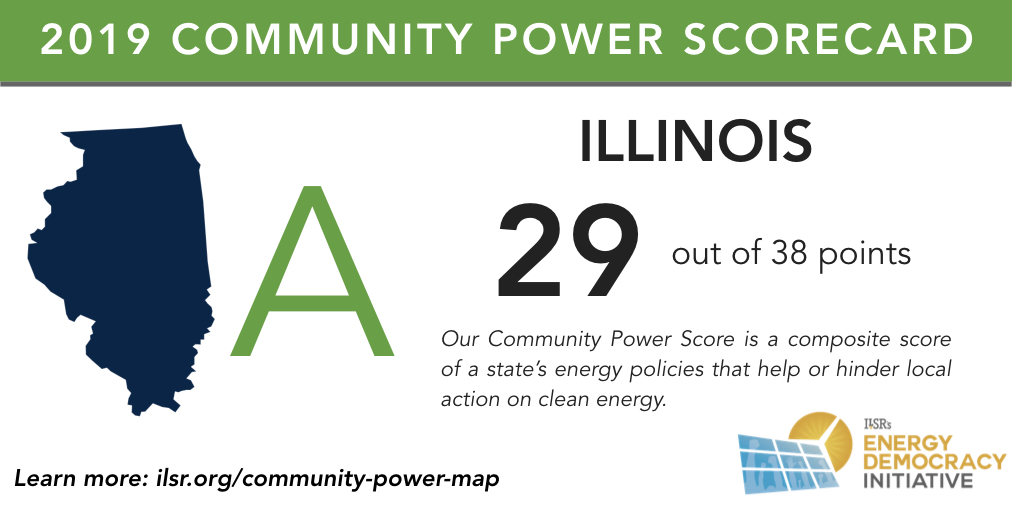
Illinois has a Community Power score of 29 out of 38. The state has many policies encouraging local power, including net metering and simplified interconnection to encourage distributed energy resources like solar, as well as requiring utility renewable energy procurement to include distributed resources. It also allows shared/community renewable energy, communities to pick their energy suppliers, and allows communities to provide financing to commercial properties with property assessed clean energy. Illinois doesn’t offer a standard contract for distributed renewable energy projects or a stretch building energy code for cities to go further than the state standard. Its shared renewables program could also be improved.

New Jersey has a Community Power score of 27 out of 38. Notably, New Jersey passed and enacted a landmark energy policy bill in 2018 that enables a new community solar pilot program, which helped its overall score (read an earlier analysis of this community solar program’s model rules). The state has many policies encouraging local power, including net metering (including aggregate net metering for public entities) and above average interconnection to encourage distributed energy resources like solar, as well as requiring utility renewable energy procurement to include distributed resources. It also allows communities to pick their energy suppliers, and allows communities to provide financing to residential and commercial properties with property assessed clean energy. New Jersey doesn’t offer a standard contract for distributed renewable energy projects or a stretch building energy code for cities to go further than the state standard.
The Bottom 5 States
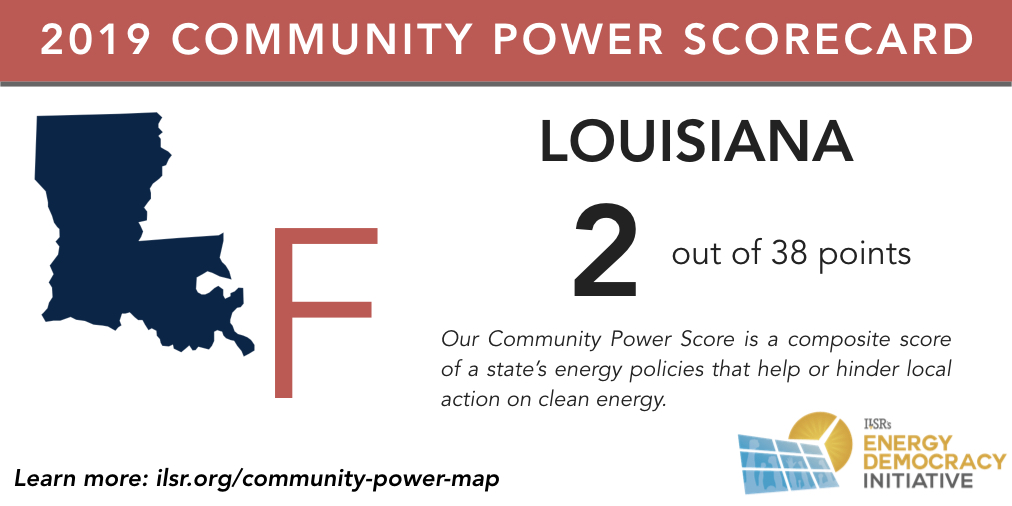
Louisiana has a Community Power score of 2 out of 38. It is tied with Alabama for the lowest scoring state and receives an F in our grade. The state gets a passing grade on its net-metering environment, but fails in every other category we graded.
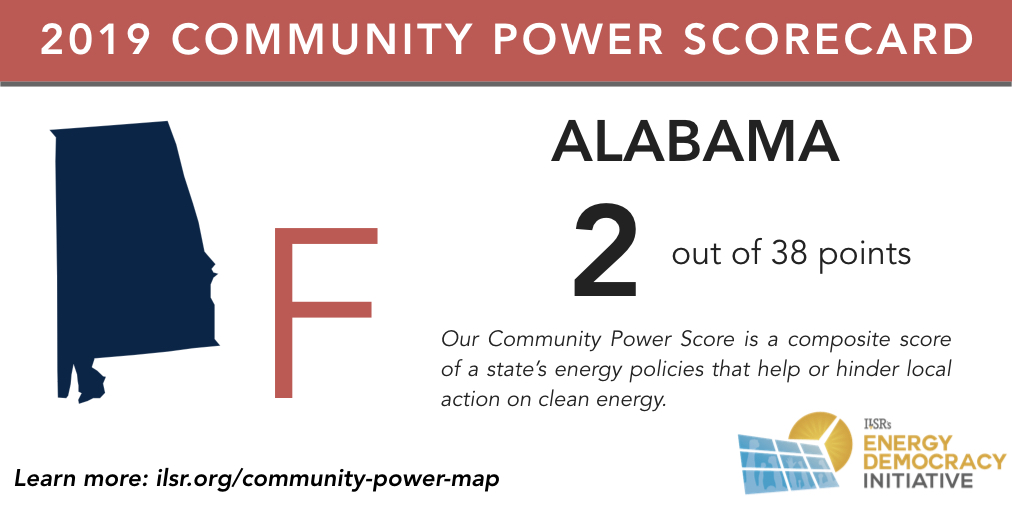
Alabama has a Community Power score of 2 out of 38. It is tied with Louisiana for the lowest scoring state and receives an F in our grade. The state allows communities to provide energy financing to commercial properties with property assessed clean energy, but lacks any other significant policy to support local renewable energy development.
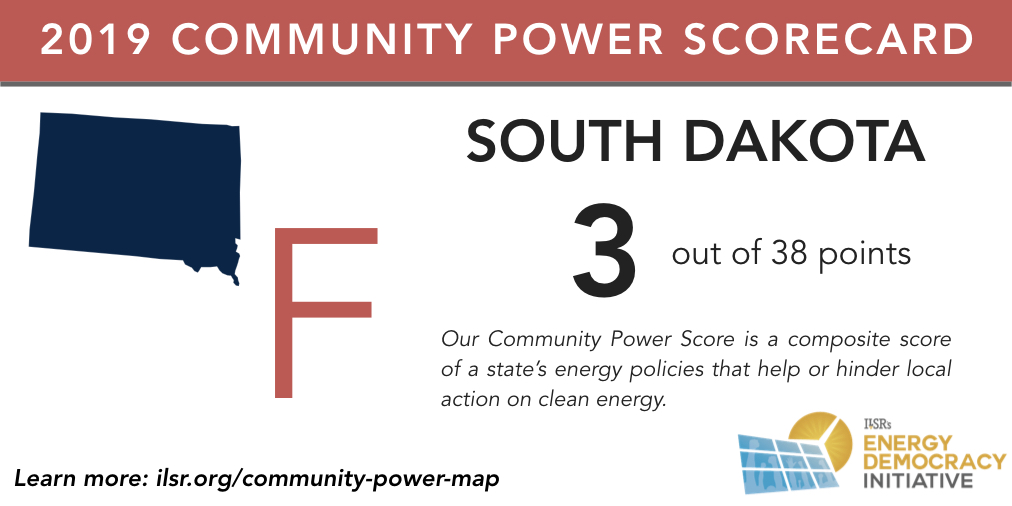
South Dakota has a Community Power score of 3 out of 38. South Dakota’s score is tied with those of North Dakota and Kansas; its policies receive an F in our grade. The state allows communities to set their own building energy codes and receives a passing (C) grade for its grid interconnection rules (slightly better than either North Dakota and Kansas), but lacks any other significant policy to support local renewable energy development.
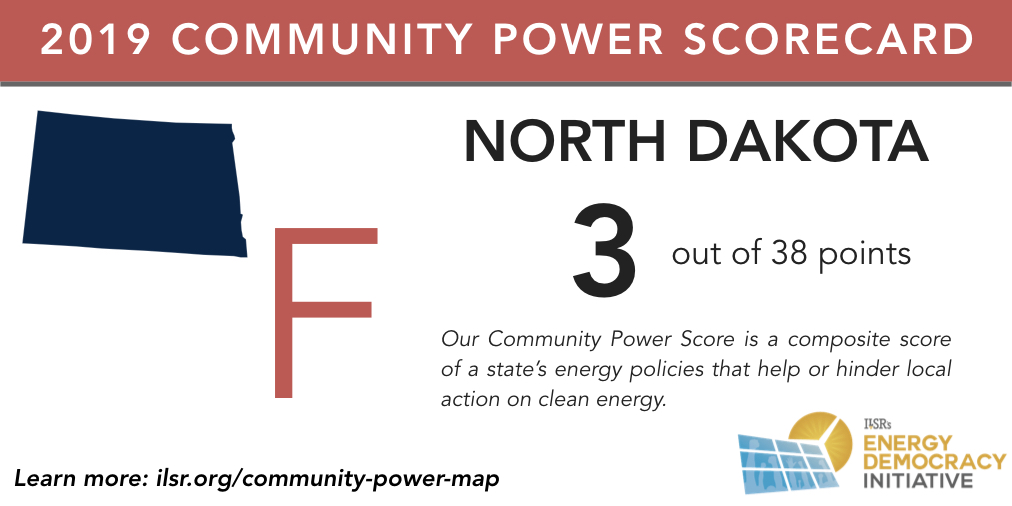
North Dakota has a Community Power score of 3 out of 38. North Dakota’s score is tied with those of South Dakota and Kansas; its policies receive an F in our grade. The state allows communities to set their own building energy codes and receives a mediocre but failing (D) grade for its net metering environment, which is slightly better than South Dakota. The state lacks other significant policy to support local renewable energy development.

Kansas has a Community Power score of 3 out of 38. Similar to North Dakota, the state allows communities to set their own building energy codes and receives a mediocre but failing (D) grade for net metering environment, but lacks nearly every other possible policy for supporting local energy action.
Correction: The 2019 Community Power Scorecard table, above, was updated in April 2019 to correct an error in the original concerning Virginia’s statewide building energy code standard. State policy in Virginia does not fall into the definition of a “stretch code,” and the state does not currently allow for statewide requirements to be “altered by local jurisdictions,” which we had incorrectly reported in the state’s original score. As a result, Virginia’s final, corrected score is 11 points. Even with this adjustment, Virginia receives a “C” letter grade.
This article originally posted at ilsr.org. For timely updates, follow John Farrell or Marie Donahue on Twitter, our energy work on Facebook, or sign up to get the Energy Democracy weekly update.
![]()
![]()
![]()
![]()