Correction: Our 2019 Community Power Scorecard was updated in April 2019 to correct an error in the original concerning the score given to the state of Virginia, after incorrectly reporting its statewide building energy code as a “stretch code” (the state does not currently allow for statewide requirements to be “altered by local jurisdictions”). As a result of this correction, both Virginia and other states’ rankings shifted in 2019. The final rankings and comparison presented below have been updated accordingly.
How state policy changes from one year to the next can be a useful way to understand where states are headed when it comes to supporting local clean energy policy.
Which states have maintained strong policies or strengthened those that support local, clean energy, and which have fallen behind compared to last year?
The Institute for Local Self-Reliance released our 2019 Community Power State Scorecard earlier this year, and we have taken a closer look at why state energy policy matters and how states stack up to their neighbors. In another recent analysis, we illustrate how much and what percentage of distributed solar capacity each state hosts to show what’s possible when states consistently support local, clean energy and help advocates, lawmakers, and community members push more states to do so.
Building on recent Scorecard results and these resources, we also wanted to examine how states scored across time to draw conclusions about which states are consistent leaders, which are on the right track, and which have more work to do when it comes to supporting local clean energy.
Explore the national 2019 Community Power Scorecard and our companion post Why ILSR’s 2019 Community Power Scorecard Matters. Find more information on state policy and local clean energy programs on our interactive Community Power Map.
To do so, we compared the relative rankings of states between the two most recent years of our Scorecard results. Due to an adjustment in our methodology this year regarding how states scored in both net metering and shared renewable programs (which affected the number of available points in these categories and across the total scorecard), comparing raw scores from 2018 and 2019 without adjustment, as we did last year, would be misleading. A detailed description of Scorecard criteria and component scores is available on our interactive Community Power Map page.
Comparing State Scorecard Rankings Between 2019 and 2018
| State | Scorecard Ranking (out of 50 states and D.C.) |
Change in Rankings | |
| 2019 | 2018 | ||
| Nebraska | 25 | 48 | Increased in ranking (at least 3 spots). |
| Texas | 31 | 47 | Increased in ranking (at least 3 spots). |
| Montana | 35 | 44 | Increased in ranking (at least 3 spots). |
| Vermont | 6 | 12 | Increased in ranking (at least 3 spots). |
| New Hampshire | 11 | 16 | Increased in ranking (at least 3 spots). |
| Maine | 22 | 27 | Increased in ranking (at least 3 spots). |
| Tennessee | 46 | 51 | Increased in ranking (at least 3 spots). |
| Nevada | 13 | 17 | Increased in ranking (at least 3 spots). |
| Oklahoma | 38 | 41 | Increased in ranking (at least 3 spots). |
| Idaho | 43 | 46 | Increased in ranking (at least 3 spots). |
| Connecticut | 18 | 20 | Little to no change in ranking. |
| Missouri | 21 | 23 | Little to no change in ranking. |
| California | 2 | 3 | Little to no change in ranking. |
| New Mexico | 17 | 18 | Little to no change in ranking. |
| Delaware | 23 | 24 | Little to no change in ranking. |
| Pennsylvania | 24 | 25 | Little to no change in ranking. |
| Massachusetts | 1 | 1 | Little to no change in ranking. |
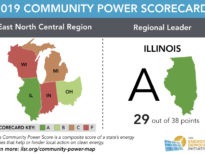
| Illinois | 4 | 4 | Little to no change in ranking. |
| New Jersey | 5 | 5 | Little to no change in ranking. |
| Colorado | 10 | 10 | Little to no change in ranking. |
| Minnesota | 15 | 15 | Little to no change in ranking. |
| Washington | 19 | 19 | Little to no change in ranking. |
| South Carolina | 26 | 26 | Little to no change in ranking. |
| Florida | 30 | 30 | Little to no change in ranking. |
| Alaska | 42 | 42 | Little to no change in ranking. |
| South Dakota | 49 | 49 | Little to no change in ranking. |
| New York | 3 | 2 | Little to no change in ranking. |
| Oregon | 7 | 6 | Little to no change in ranking. |
| Ohio | 8 | 7 | Little to no change in ranking. |
| District of Columbia | 9 | 8 | Little to no change in ranking. |
| Hawaii | 14 | 13 | Little to no change in ranking. |
| Utah | 29 | 28 | Little to no change in ranking. |
| Wyoming | 33 | 32 | Little to no change in ranking. |
| Arkansas | 34 | 33 | Little to no change in ranking. |
| Alabama | 51 | 50 | Little to no change in ranking. |
| Maryland | 16 | 14 | Little to no change in ranking. |
| Rhode Island | 12 | 9 | Drop in ranking (at least 3 spots). |
| Arizona | 32 | 29 | Drop in ranking (at least 3 spots). |
| Kentucky | 37 | 34 | Drop in ranking (at least 3 spots). |
| Iowa | 41 | 38 | Drop in ranking (at least 3 spots). |
| North Dakota | 48 | 45 | Drop in ranking (at least 3 spots). |
| West Virginia | 39 | 35 | Drop in ranking (at least 3 spots). |
| Wisconsin | 40 | 36 | Drop in ranking (at least 3 spots). |
| Kansas | 47 | 43 | Drop in ranking (at least 3 spots). |
| Georgia | 36 | 31 | Drop in ranking (at least 3 spots). |
| Mississippi | 45 | 40 | Drop in ranking (at least 3 spots). |
| Virginia | 27 | 21 | Drop in ranking (at least 3 spots). |
| Michigan | 28 | 22 | Drop in ranking (at least 3 spots). |
| Indiana | 44 | 37 | Drop in ranking (at least 3 spots). |
| North Carolina | 20 | 11 | Drop in ranking (at least 3 spots). |
| Louisiana | 50 | 39 | Drop in ranking (at least 3 spots). |
| NOTE: Our 2019 Community Power Scorecard relied on a revised methodology with new criteria used to score state net metering and shared renewable policies. The 2019 Scorecard used a total of 38 possible points, whereas our 2018 Scorecard used a total of 36 points. As a result, we felt more comfortable comparing states’ relative rankings (out of 51) across years than the raw Community Power Scores themselves, which we had used in last year’s comparison. | |||
What This Scorecard Comparison Tells Us
In this comparison, we find 25 states and the District of Columbia saw little to no change in their score over the past year — including many consistent leaders in local, clean energy, including Massachusetts, California, New York, New Jersey, and Illinois (which have all scored in the top five in our Community Power Scorecard for three years in a row). Three of these — New York, Massachusetts, and New Jersey — also claim top spots for the proportion of their solar energy coming from distributed sources.
Ten states improved their ranking by at least three spots, whereas 15 states dropped in their ranking. While some of these changes can be attributed to methodology changes (e.g., more nuanced criteria for receiving points in the shared renewables category that increased points awarded to some state programs and decreased others), there were still other substantive policy changes that affected states’ overall scores — shaking up where many states fell in our ranking.
For example, a larger number of states now allow local communities to set “stretch” building energy efficiency codes that go beyond the state standard or have policies enabling commercial or residential property assessed clean energy programs.
On the other hand, some states have been working to dismantle net metering policies and saw drops in those scores. In Michigan, for example, a new policy went into effect in 2018 that no longer credits the owner of the solar panel for offsetting their own use. This caused the net metering component of the state’s score to drop — even while it improved in other areas, including in how solar projects connect to the electricity grid. While Connecticut increased in the rankings likely based on points awarded for its shared renewable policy, the state’s lawmakers have, like Michigan, been working to dismantle the state’s net metering policy, passing a law in 2018 that would eliminate net metering by 2022. Because net metering continues in the state for now, it was not docked points this year, although unless it reverses this policy, it will likely score lower in the future.
To explore state policies and other programs that support local power in the energy sector in more detail, be sure to take a closer look at ILSR’s Community Power Map. In addition, we will continue to track state policies that enable local clean energy, releasing our Community Power Scorecard and related comparisons in future years.
How will your state compare to its peers and past performance next year? Policies and rules made by legislatures and regulatory agencies (including state public utility commissions) can affect a state’s score and ranking. As such, expressing support for policies that enable local, clean energy to your state officials is an important way to engage throughout the year.
This article originally posted at ilsr.org. For timely updates, follow John Farrell or Marie Donahue on Twitter or get the Energy Democracy weekly update. Also check out over 50 episodes of the Local Energy Rules podcast!
Photo Credit: U.S. Dept. of Energy via Flickr (U.S. Government Works license)