Editorial Note: It came to our attention that the underlying data used for this 2017 Annual Update of new power generation were incomplete for both the year’s final quarter and year-end results. Utility-scale gas, wind, and solar generation as originally reported did not include data from the month of December 2017, which combined totaled just over 4900 megawatts of power. This impacted not just the results presented in this post, but also comparisons made to these results in our quarterly update 2018 Q1 analysis.
Please note the updates in the post (strikethroughs indicate in-text corrections) and new charts below, where we have corrected our error.
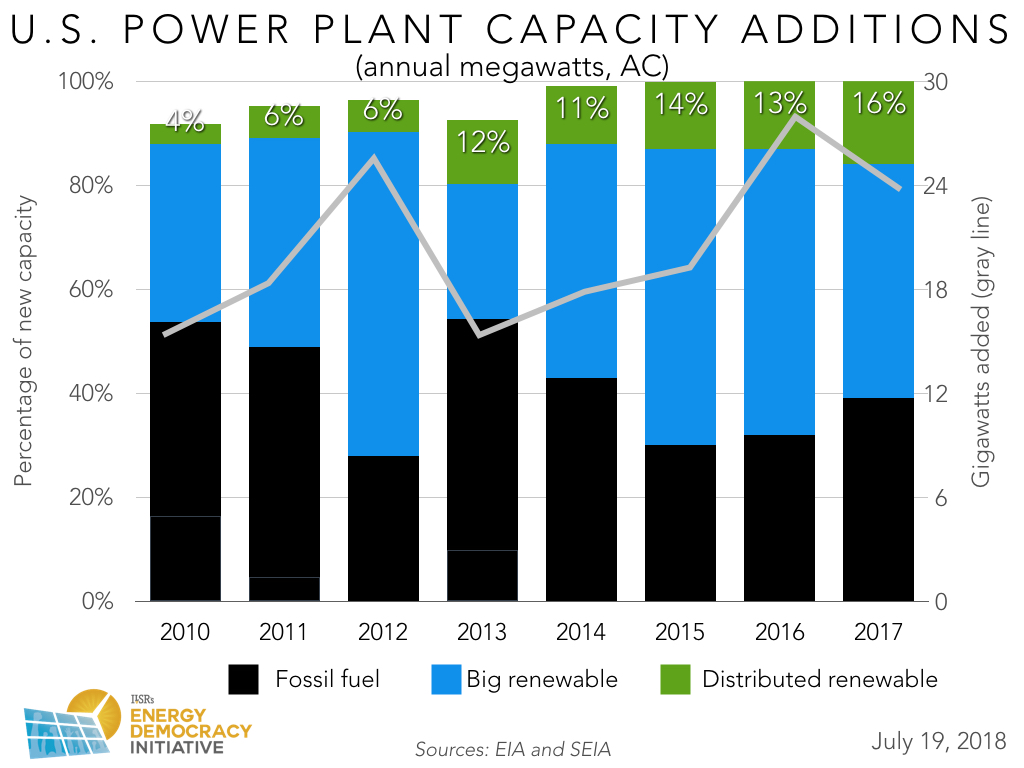
Drawing on the latest national data available on new electricity sources, 2017 may have brought more sluggish gains in total new power plant capacity to the U.S. than it had the year before, but it also brought another, more positive outcome: a notable surge in the nation’s distributed solar generation.
The U.S. only added 23.8 18.8 gigawatts of capacity in 2017, a significant drop from the 2016 total of 28 gigawatts. This trend was due in part to the fact that the rapid growth in utility-scale solar in 2016, which was believed to be unsustainable, stagnated and then dropped substantially last year.
However, the distributed or “small-scale” solar segment of the nation’s energy system, which includes, for example, residential and commercial rooftop arrays and community solar garden subscriptions, managed to buck this sluggish trend. It finished the year strong with its highest share of new generation yet, as illustrated in the charts below.
As noted above, we have updated the following charts to correct an error made in our original reporting of new power generation from 2017 Q4.
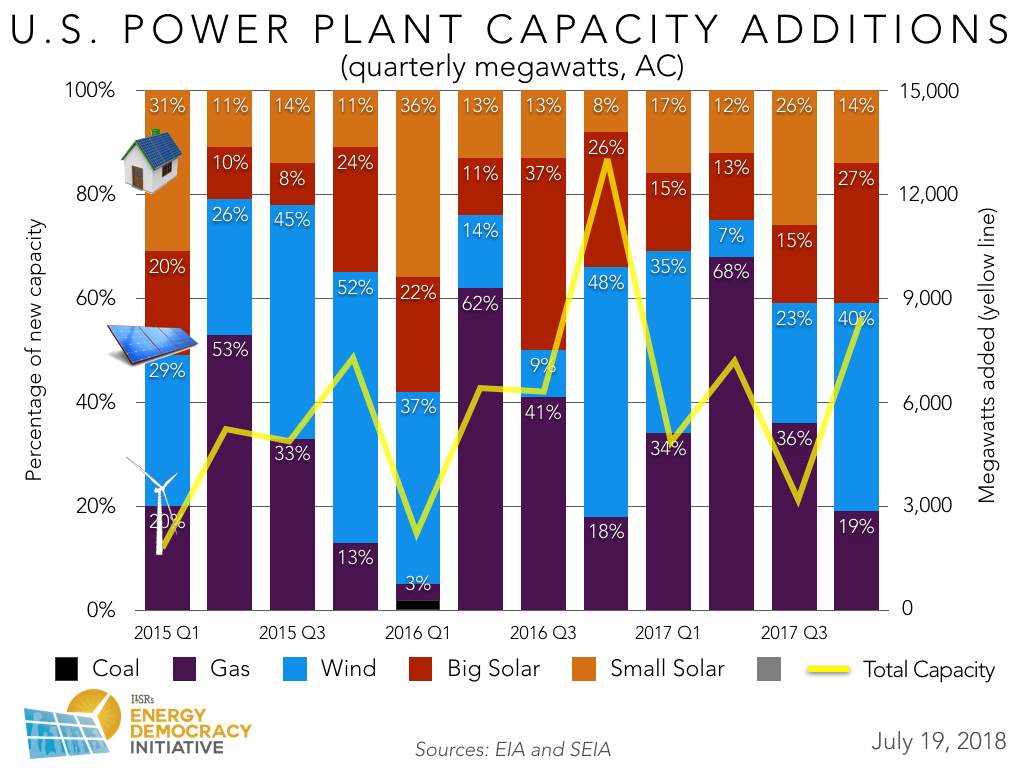
Annual New Power Plant Capacity – 2017
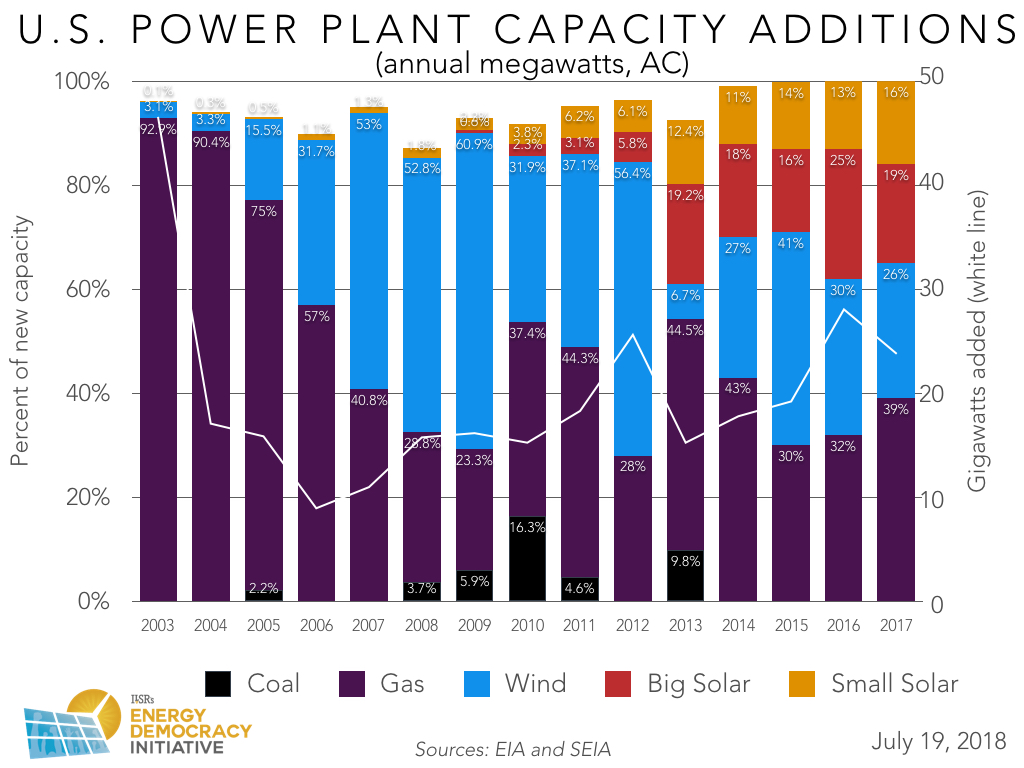
By the end of 2017, distributed solar made up 16 20 percent of the nation’s new capacity—an increase of a few seven percentage points from 2016 and, evidently, a record-setting share of total, new generation. In terms of raw capacity, small solar beat out big in two three out the four quarters of 2017 (see results disaggregated on a quarterly basis, below), contributing more than 3.7 gigawatts (AC) by the end of the year, while utility-scale solar only added about 3 gigawatts.
Interestingly, despite quarterly variation, the average shares of small and big solar evened out to contribute more than 17 percent of new generation each across the whole year. Indeed, bigger isn’t always best, as small scale appears to be keeping up the pace.
Quarterly New Power Plant Capacity – 2017 Q4
This growth in overall small-scale solar held despite slower reported growth in the residential solar portion of the distributed market. Given the current state of residential solar, some credit this positive performance in distributed solar to states such as Minnesota, where successful community solar programs are thriving.
Our earlier hedge that homes, business, and communities that invest in solar will become the power plants of the future continues to ring true as capacity from these sources make up an ever larger share of the market and start to see new financing models and more agreeable policy landscapes in states across the country. While we know small-scale electricity generation works at the local level, these latest annual and quarterly results—showing that the growth in distributed sources can and does perform better than that of utility-scale renewables—illustrate how small-scale works nationally, too.
Looking ahead, we’ll continue to track how the national energy markets unfold each quarter and how new capacity from distributed sources in particular stacks up.
Original Post
BY: JOHN FARRELL | DATE: 29 AUG 2017
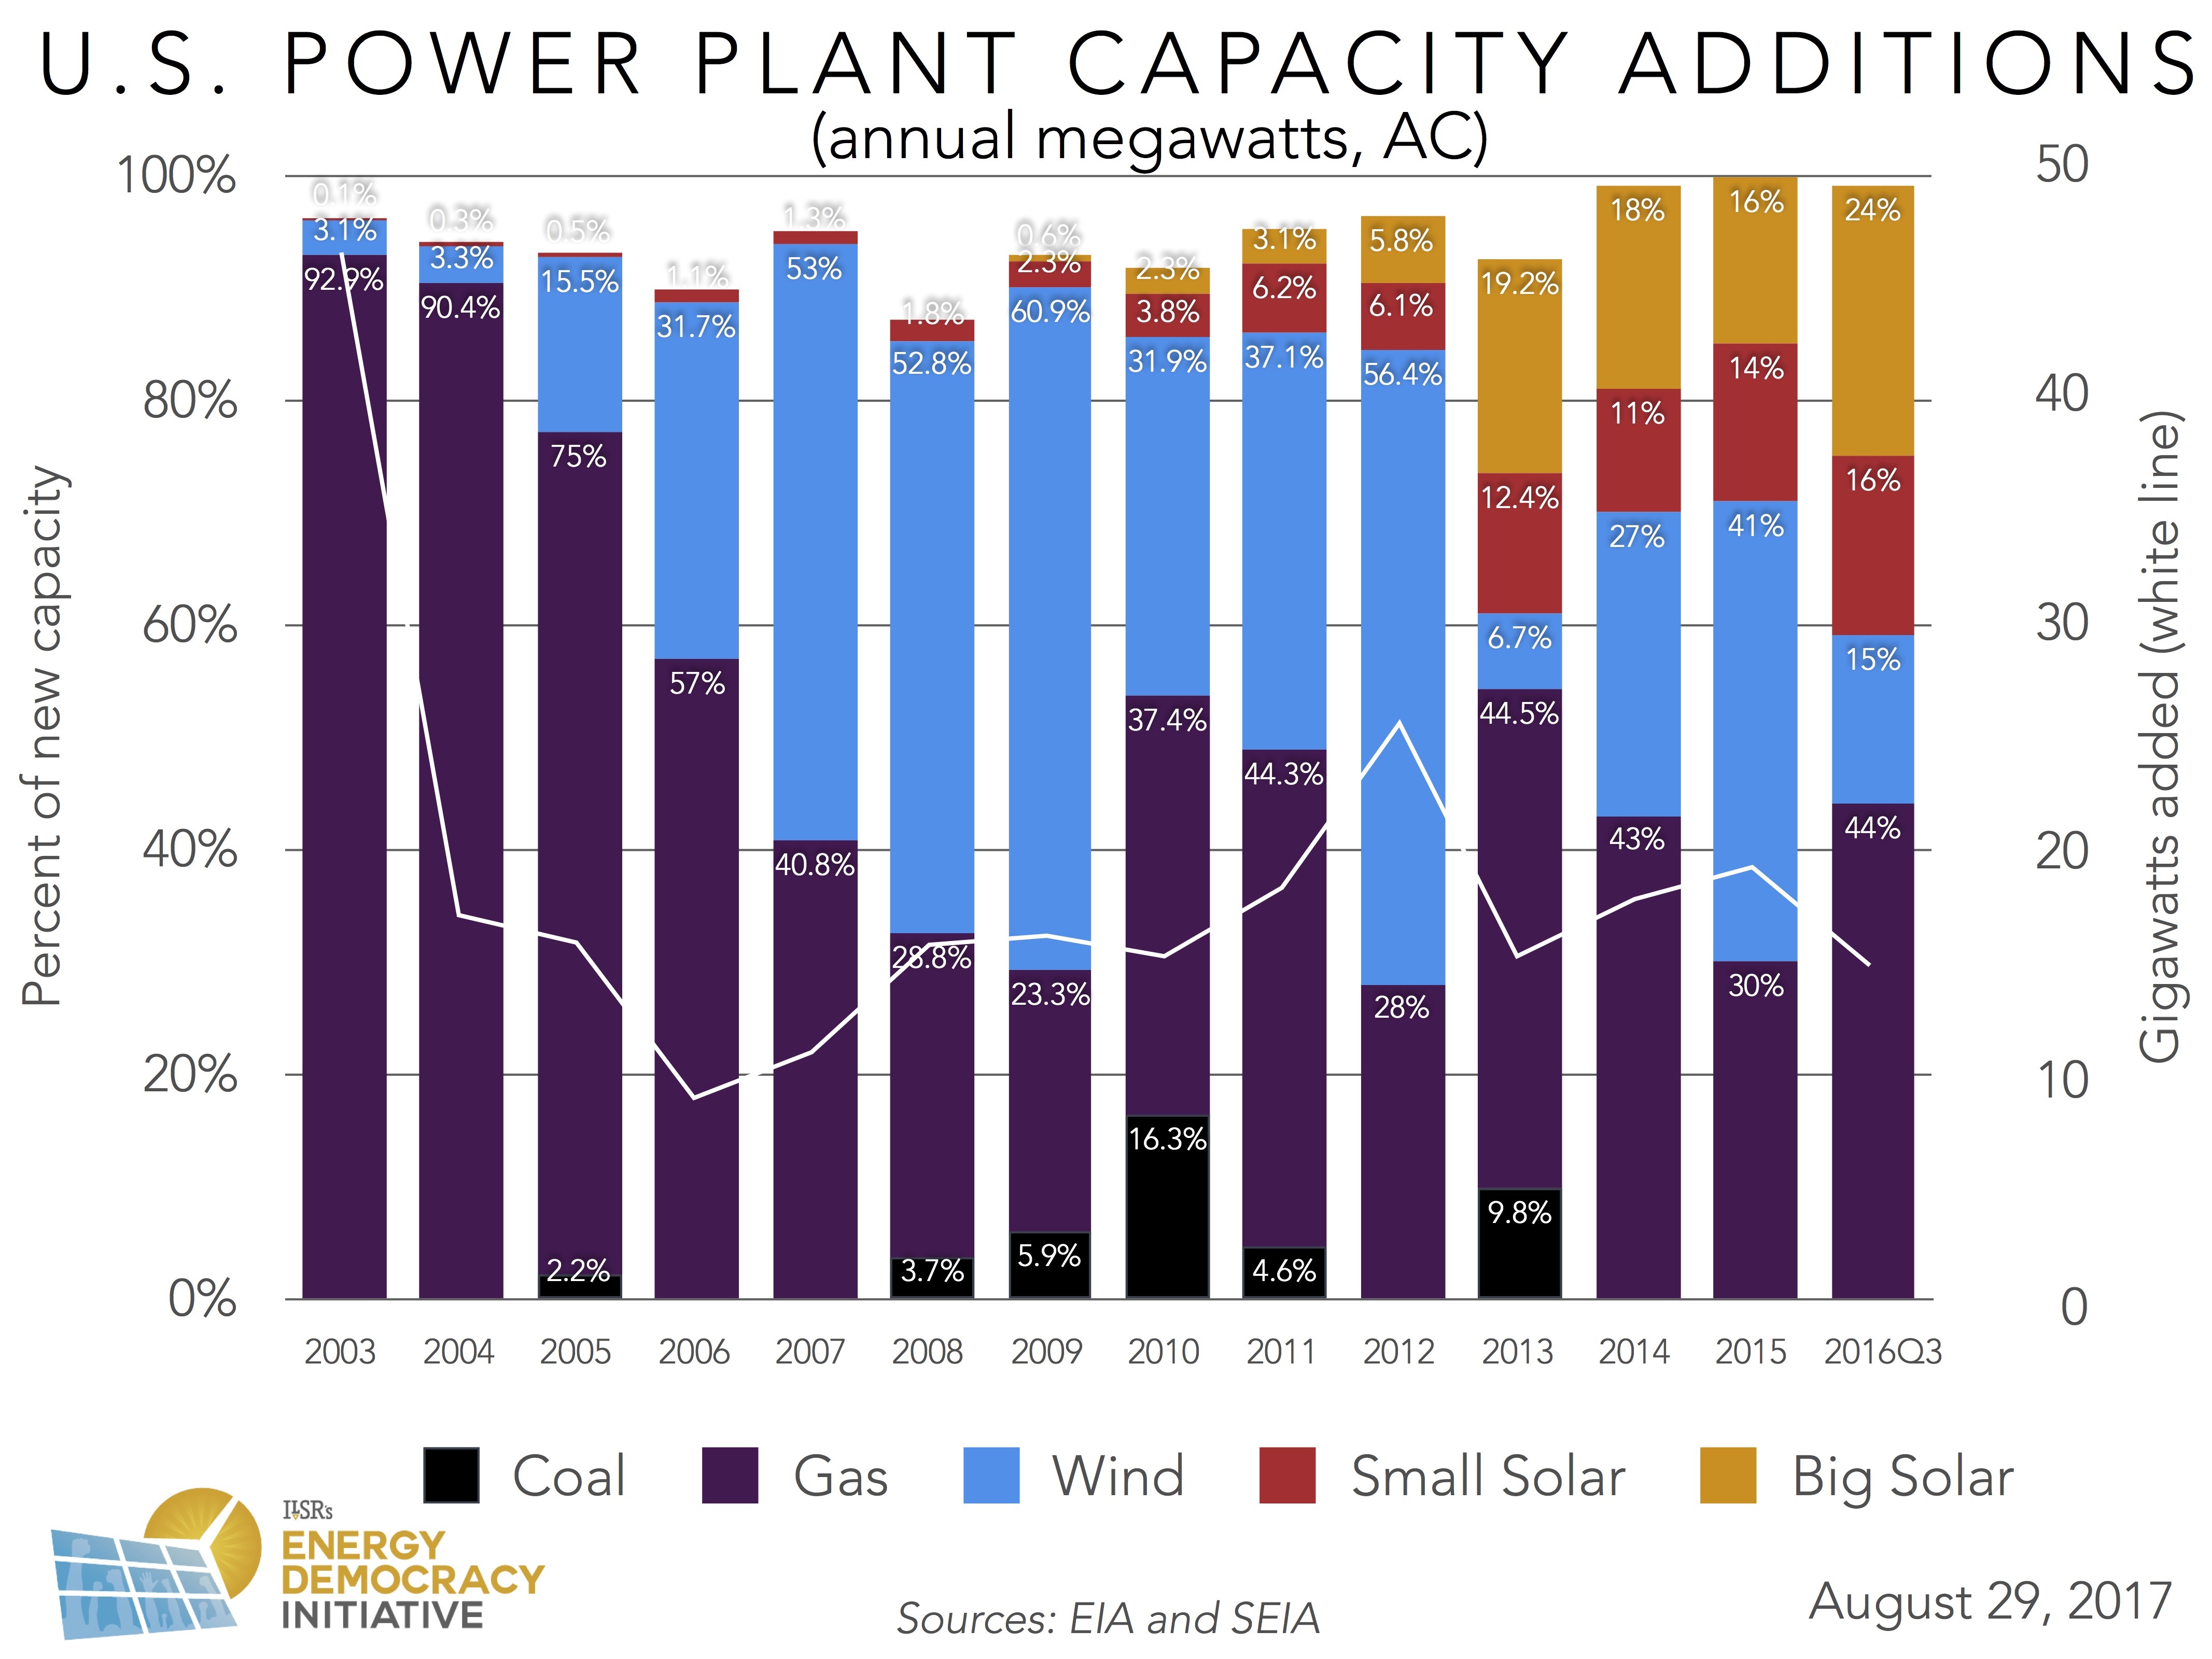
Each quarter, several sources report on the new power plants built in the United States. Since 2012, there’s been a surge in the share of new power generation coming from solar power. In that year, solar represented 10 percent of new power capacity. It rose to 40 percent in 2013 and has been 30 percent or higher in the years since.
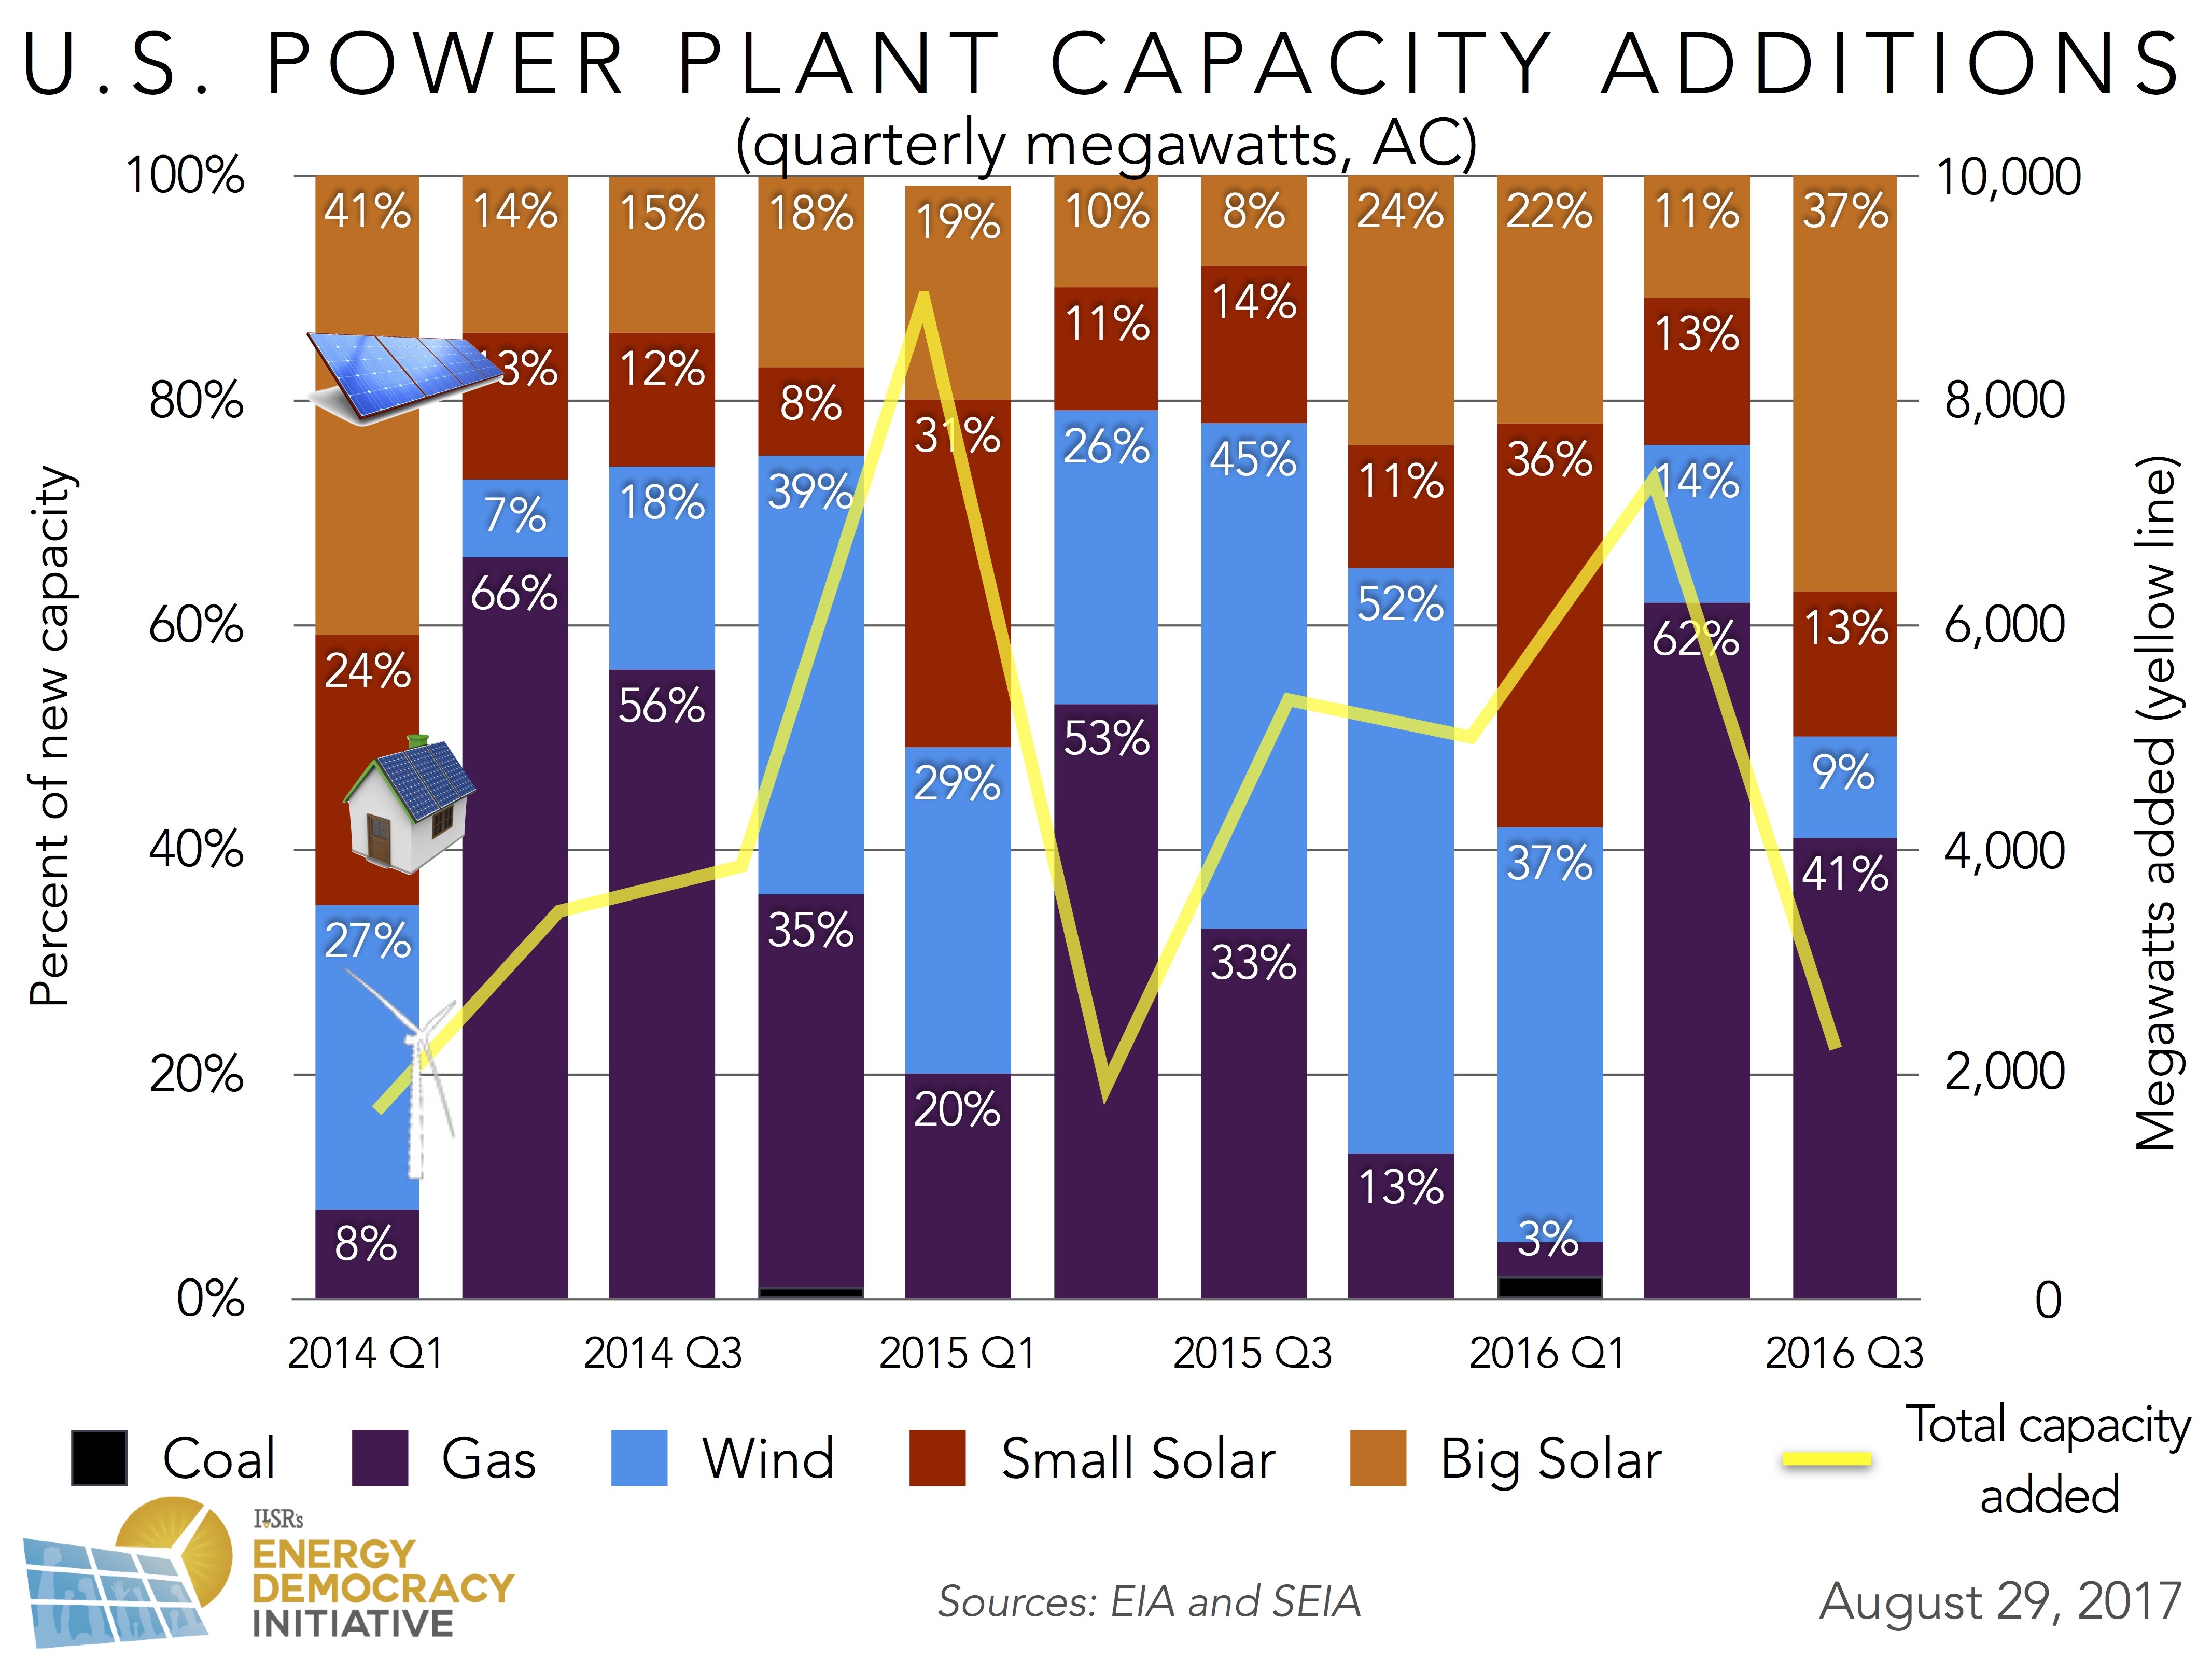
Even more remarkably is how home and business rooftops with solar are becoming the power plants of the future. In 2013, more than 12 percent of new power capacity came from small-scale solar, rising to 16 percent through the first three quarters of 2016. The following two charts show the new power capacity additions annually since 2003 and quarterly back to 2014. We’ll post updates regularly.
|
|
While the fight against solar energy is strong in some places (such as Arizona or Nevada), communities (as well as rural electric cooperatives) around the country are developing their own community-owned renewable energy resources, and even seizing upon new technologies such as microgrids to take control of their energy future.
Combined with energy storage, distributed solar is changing the calculus of energy companies, requiring utilities to adapt or start losing their customers.
These charts help illustrate the change, and we’ll keep you up to date on further changes regularly on this page.
Interested in earlier trends and analysis? Check out our archive, illustrating how new power generation has evolved in previous years.
This article originally posted at ilsr.org. For timely updates, follow John Farrell or Marie Donahue on Twitter or get the Energy Democracy weekly update.
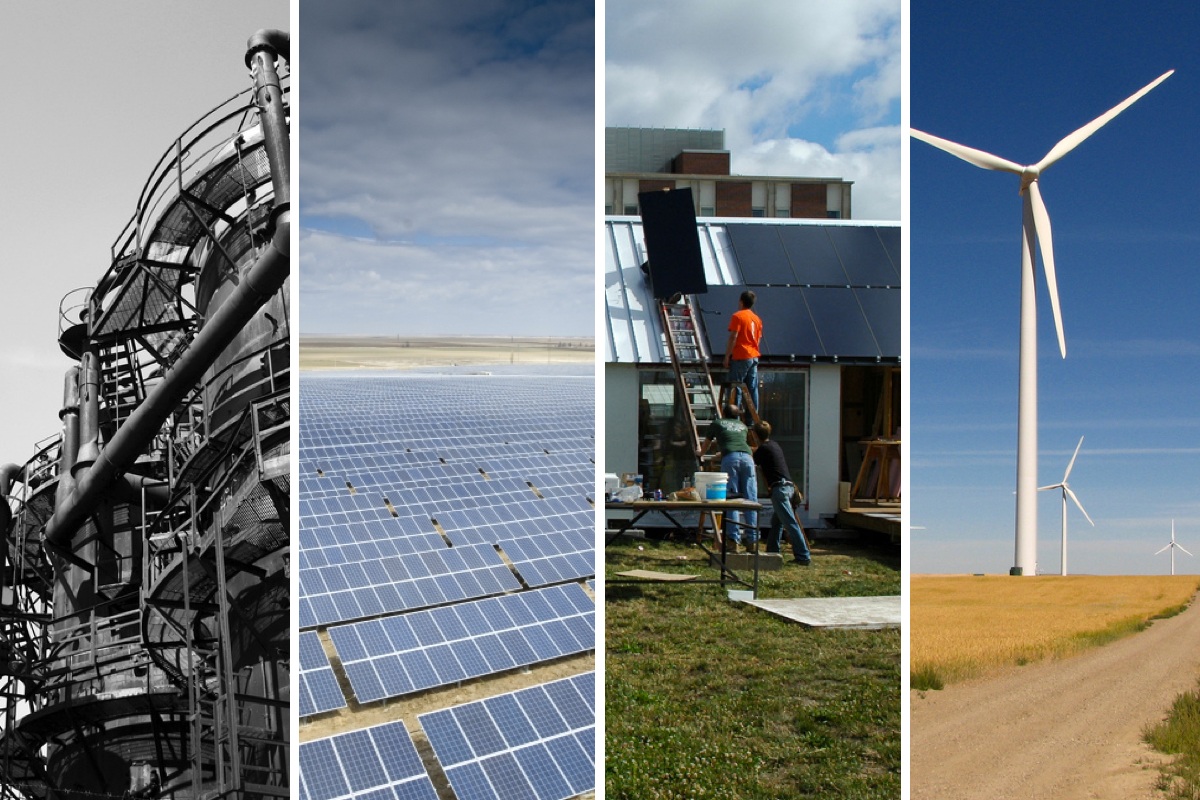
Featured Photo Credits: Panchenks / Activ Solar / stantontcady / mdmarkus66 via Flickr (CC 2.0)