Our 2020 Community Power Scorecard evaluates states based on their energy policies and how these policies help or hinder local clean energy action. We grade each state and rank them relative to one another, which you can read about in the full scorecard post.
Now, we widen our scope: how do states compare to their neighbors? Is energy democracy a regional trend? Scroll down for regional infographics and our thoughts on these bigger questions.
Drawing on results from the Institute for Local Self-Reliance’s 2020 Community Power Scorecard, we developed a new series of infographics to illustrate how states compare to others in their region and where advocates, lawmakers, and community members can look for model policies nearby that support local, clean energy.
In case you missed it, check out the 2020 Community Power Scorecard. Find more information on state policy and local clean energy programs on our interactive Community Power Map.
Regional Leaders in Local Clean Energy
Both context and geography matters for clean energy technology, policy, and advocacy. As we have mapped previously, southern states have abundant solar resources; while states across the Great Plains are known for their particularly abundant wind resources.
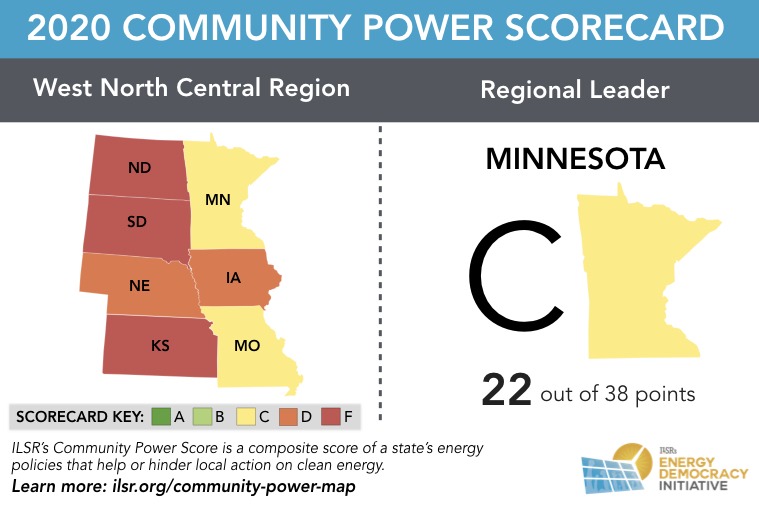
To craft policies that enable local clean energy, lawmakers in states that received a failing Scorecard grade such as North or South Dakota may find it easier to point to and replicate the success story of neighboring Minnesota’s community solar program than such programs in more distant states, including Massachusetts or Maryland.
These are just some of the reasons why taking a broader, regional look at state policies can be useful.
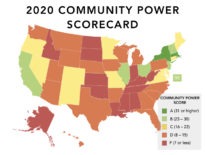
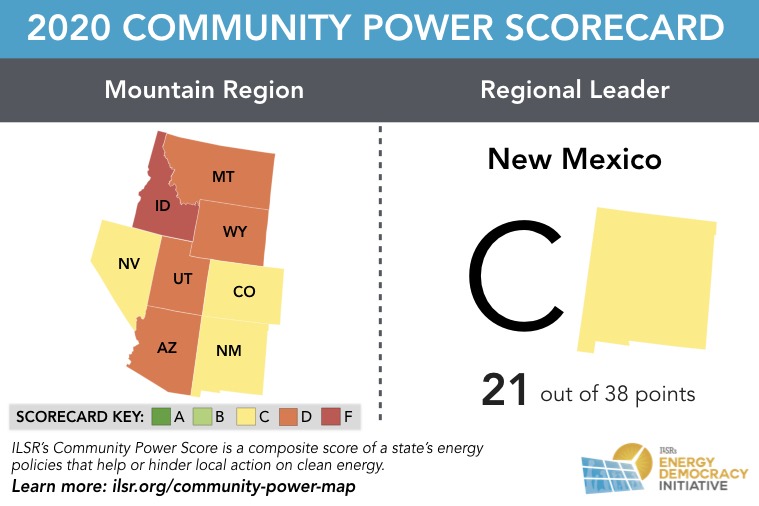
To illustrate this, we took a closer look at this year’s scorecard to find which states rank highest compared to their peers across nine regions of the country (corresponding to U.S. Census Divisions). The result is a series of infographics highlighting which states scored highest, by region. These visuals also help us compare across regions, illustrating which parts of the country claim a greater number of high scoring states than others.
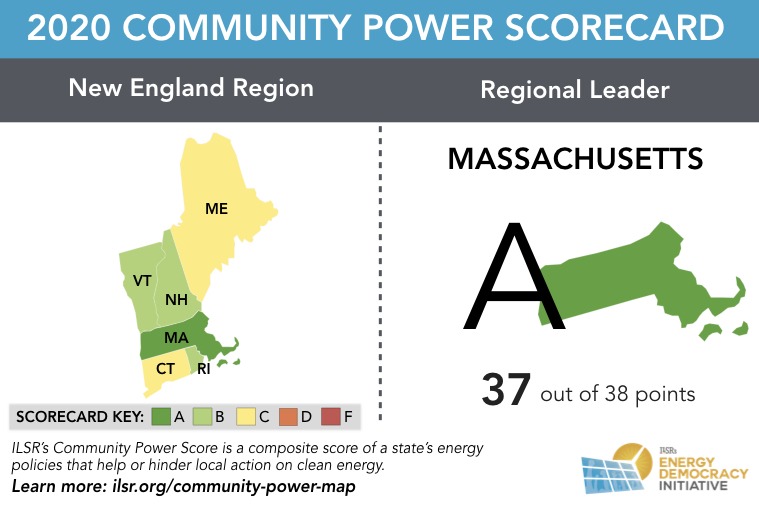
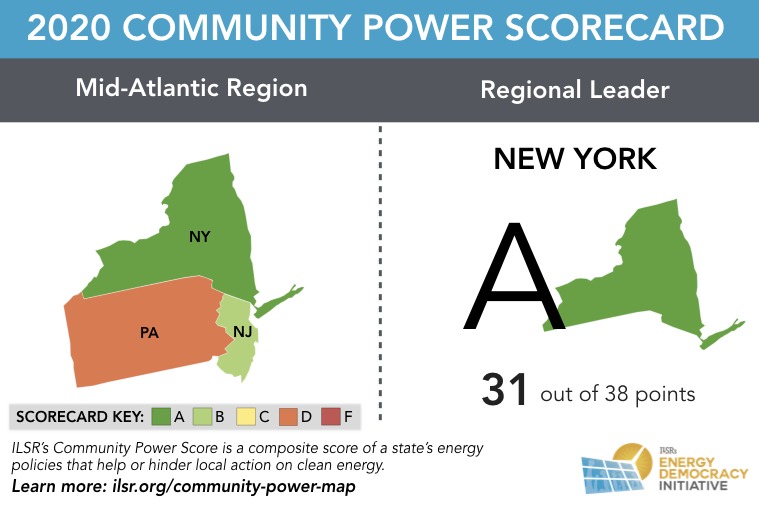
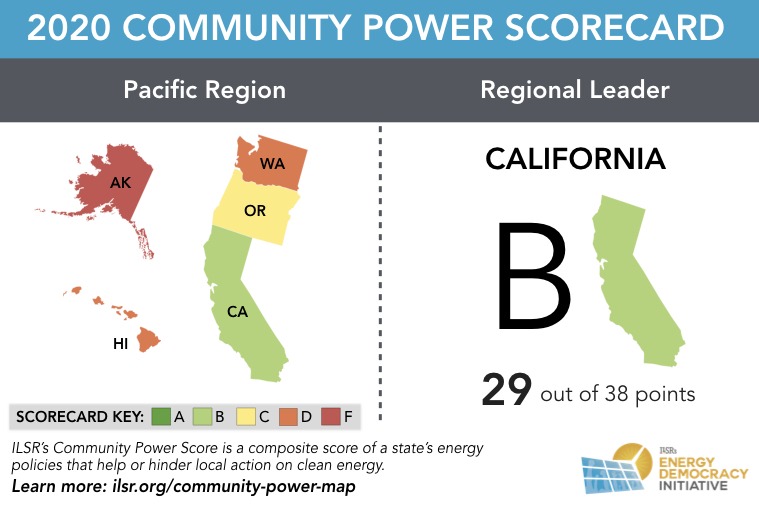
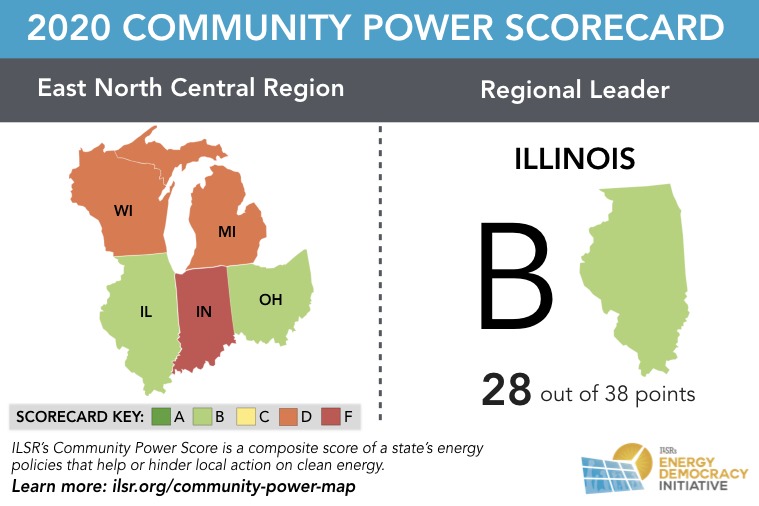
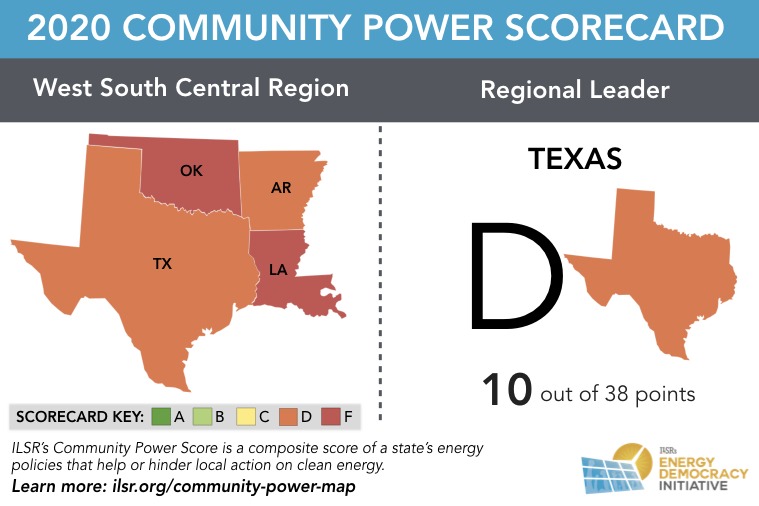
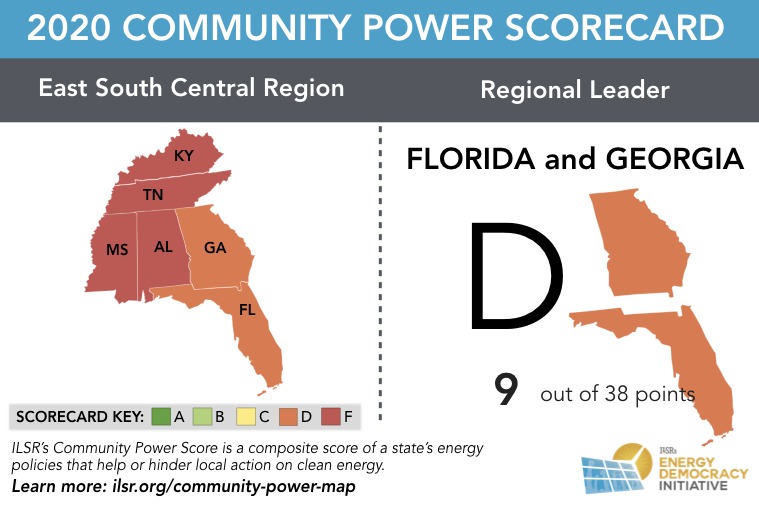
These regional comparisons provide some hope for states, because most have a neighbor with superior policies supporting energy democracy. Two regions — East South Central and West South Central — are laggards, with the “best” states sporting “D” rankings. For these regions, policymakers may need to look farther afield for leadership on policies that support local, clean energy.
This article originally posted at ilsr.org. For timely updates, follow John Farrell on Twitter, our energy work on Facebook, or sign up to get the Energy Democracy weekly update.