In this post, we illustrate the growing influence of renewable energy, both large-scale and distributed, in the U.S. energy portfolio.
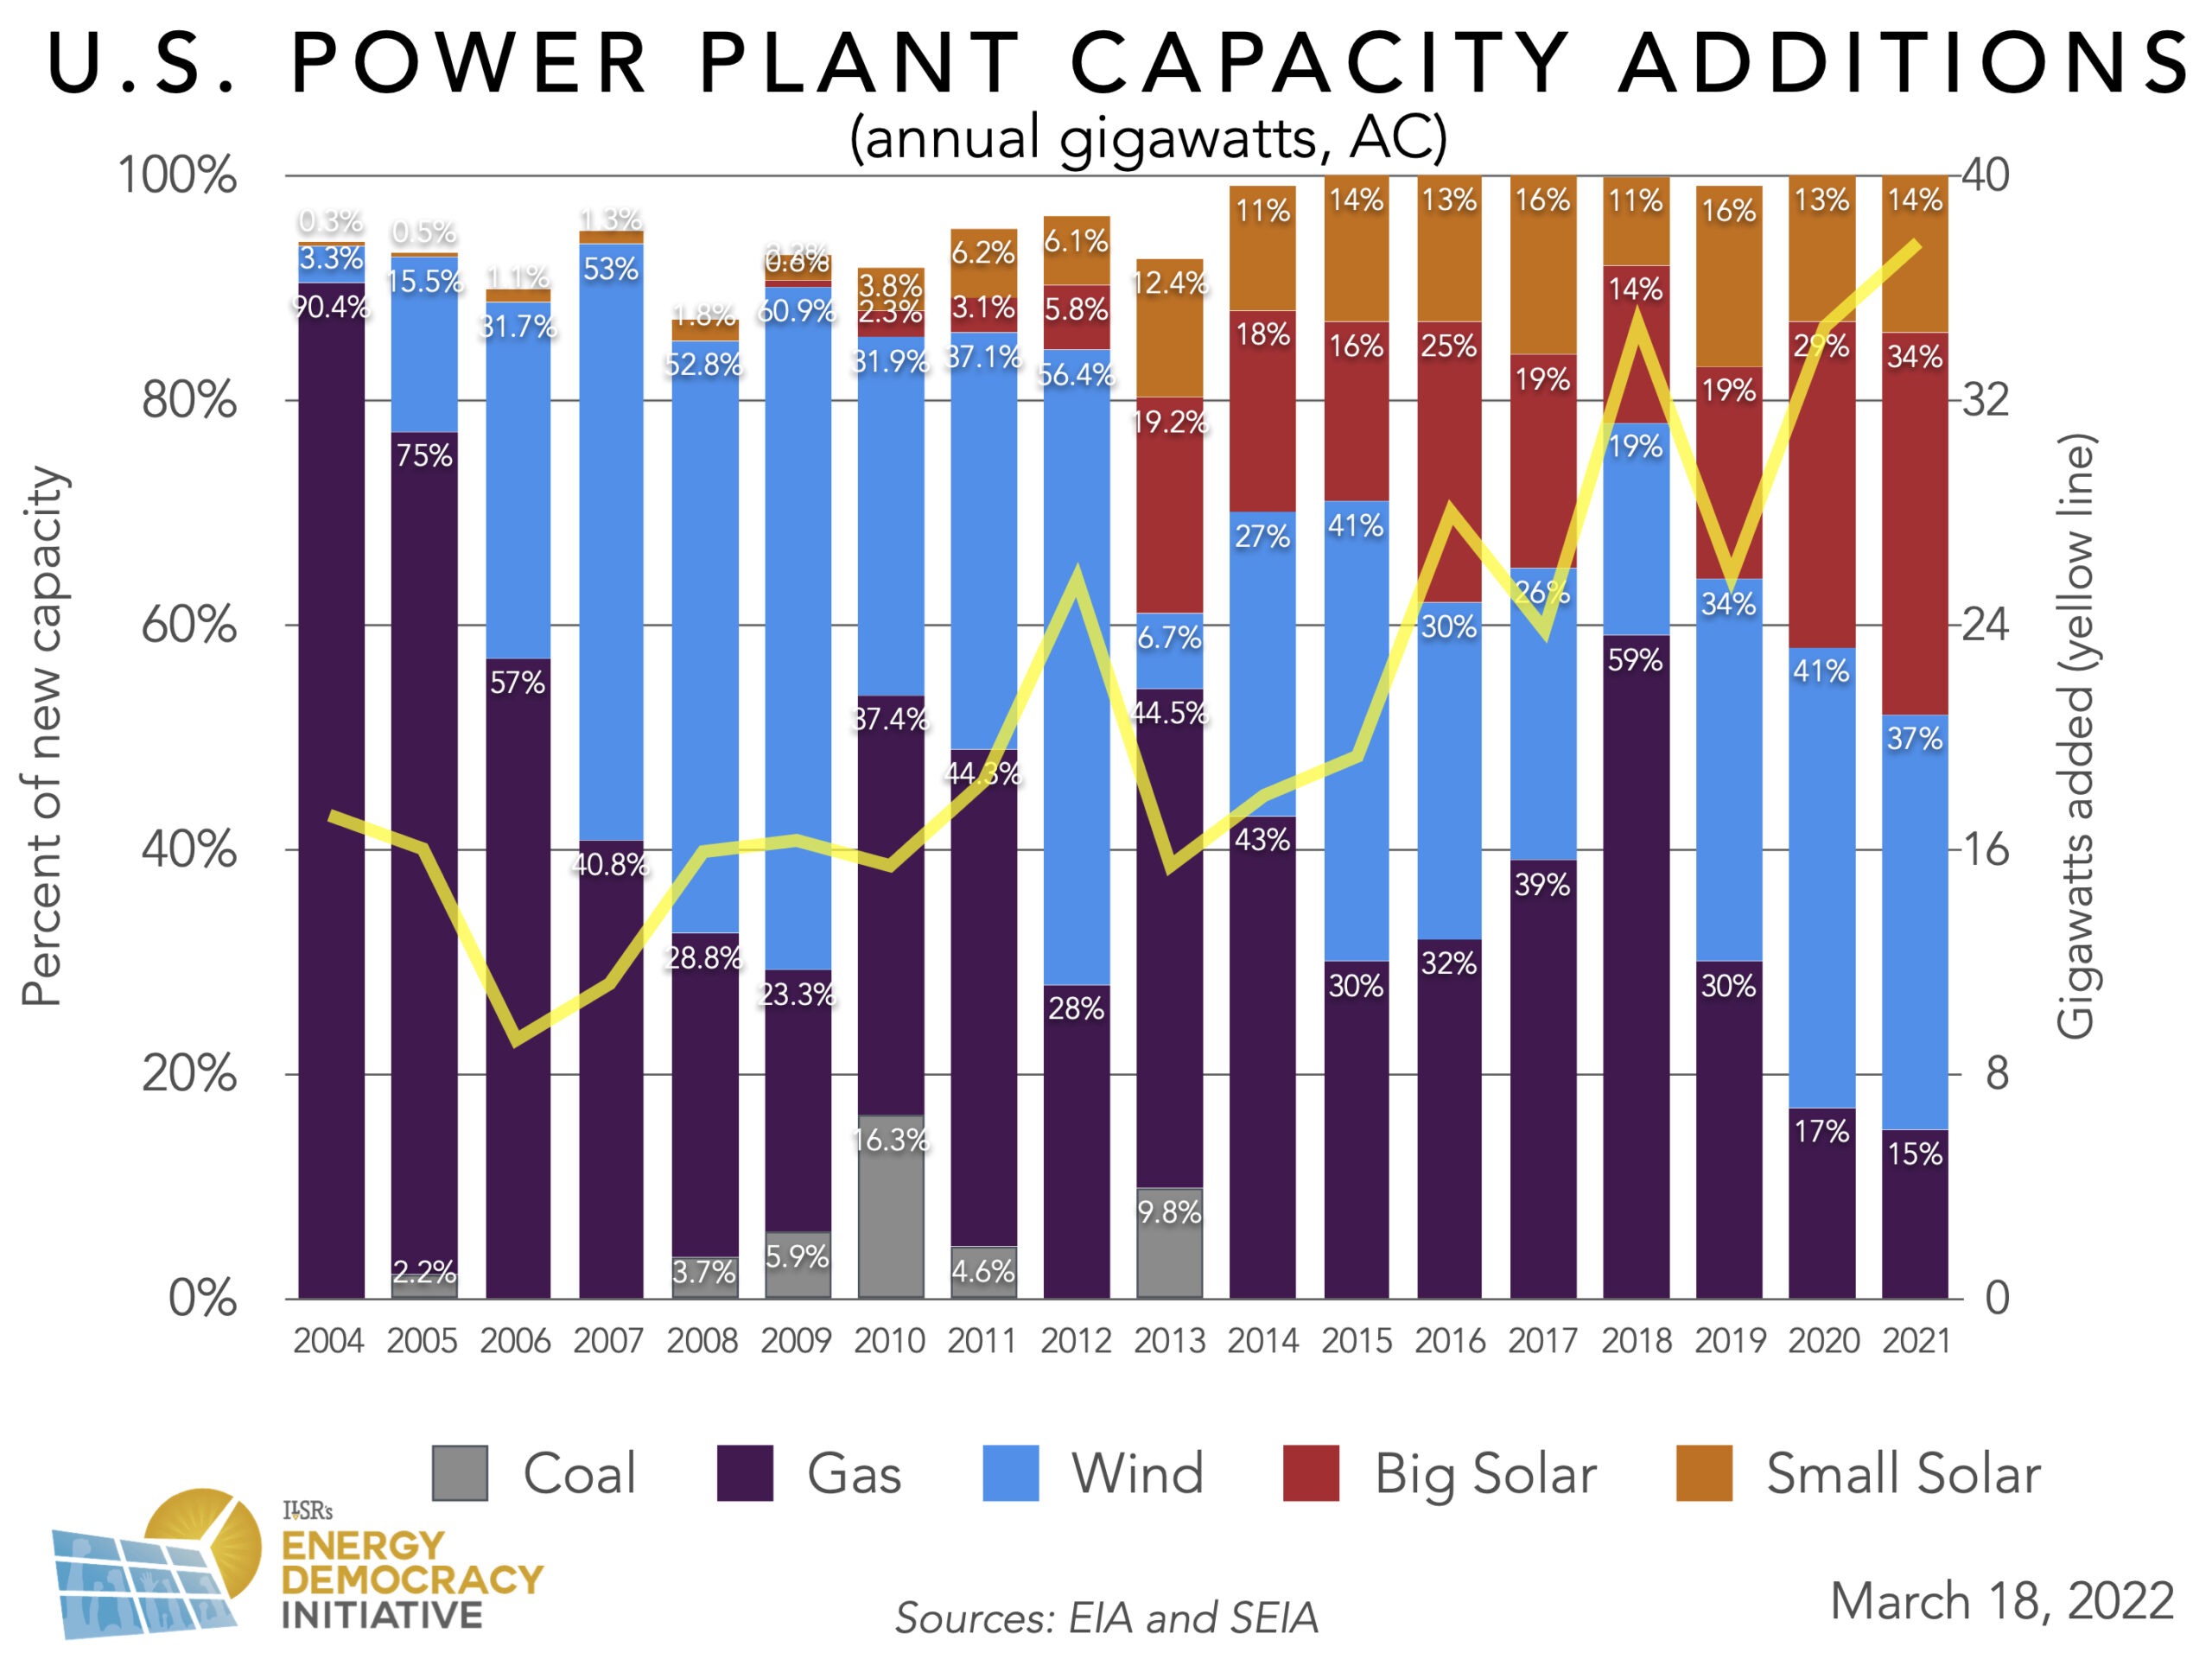
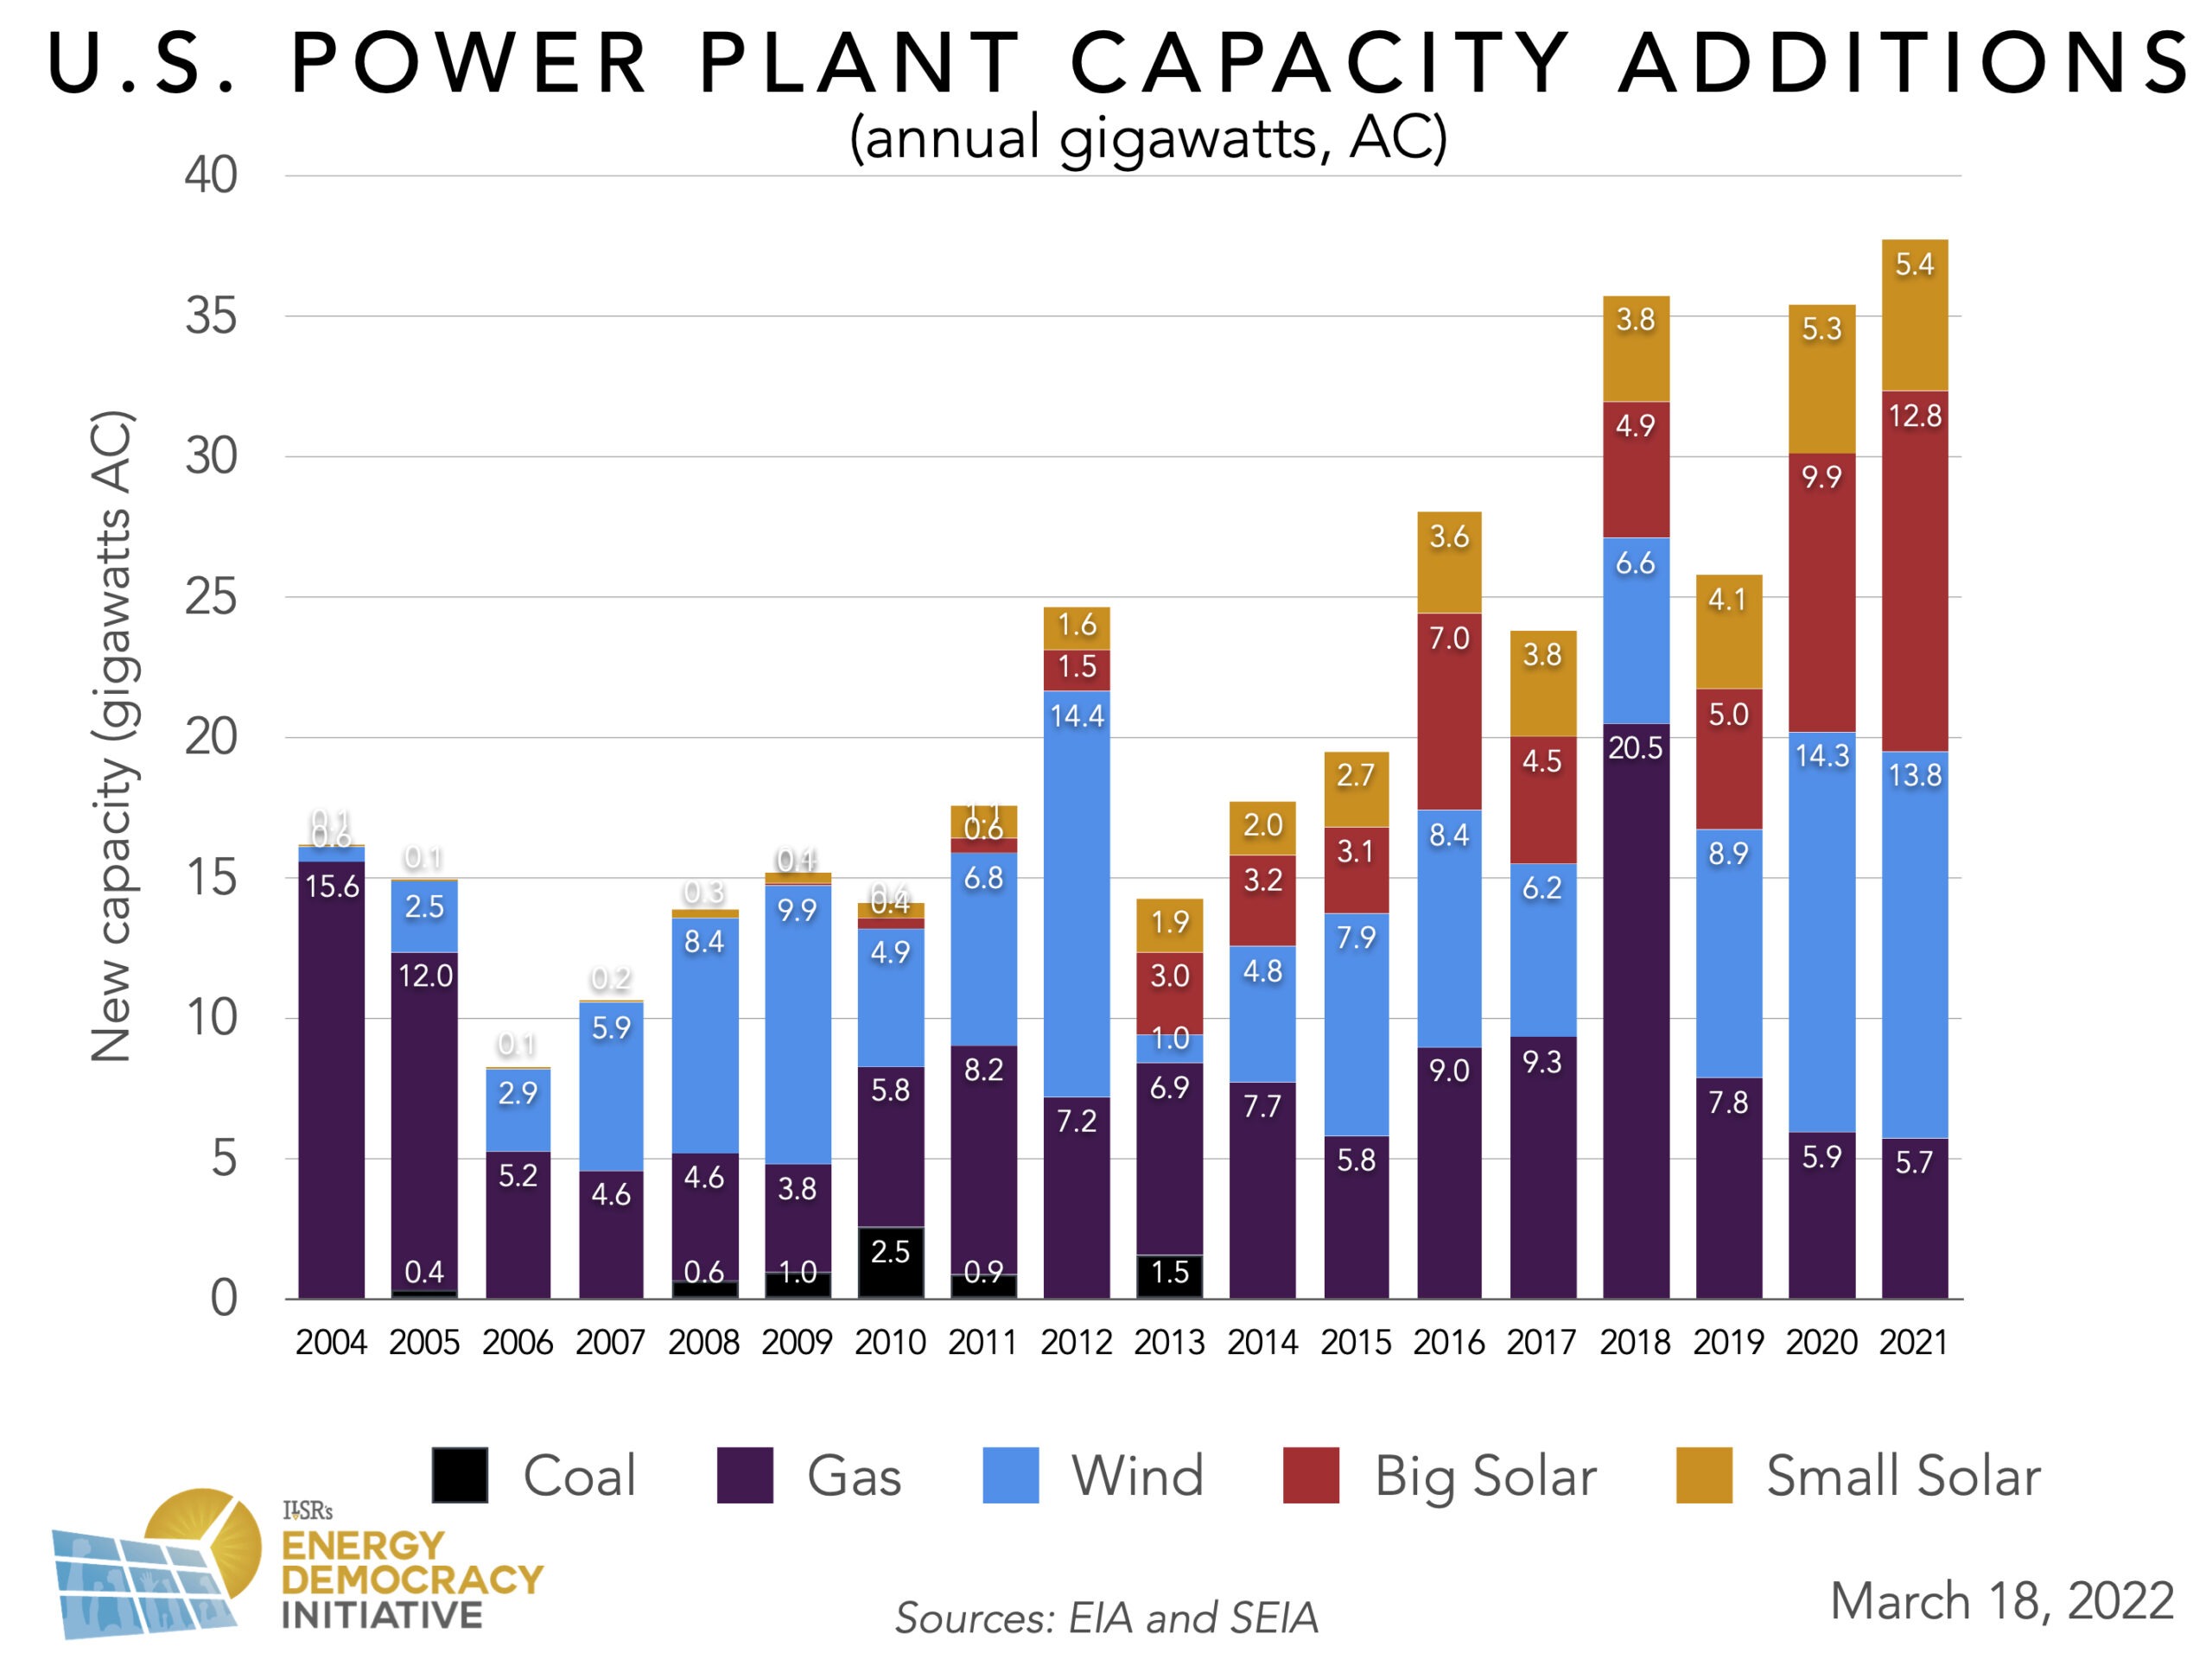
Demand for electricity in the U.S. is growing as more people turn to electric cars, appliances, and home heating. As the size of the electricity market grows, choosing to build renewable generation resources has become the norm — rather than the “alternative.” 37.6 gigawatts of electric generation capacity were added to the grid in 2021, and for the first time, nearly half of that capacity was from solar. Long overlooked as a scalable resource, the distributed solar installed in 2021 nearly matched the capacity of all gas plants built last year. In the last decade, there have been only two years in which the capacity from new gas plant construction outpaced renewable energy buildout.
Below are updated illustrations and analysis of national data on new power plant capacity, disaggregated by energy source. We present the annual results from 2021 first, followed by more detail from the fourth quarter of last year, as part of our regular quarterly reporting. This annual and quarterly report compiles data from the U.S. Energy Information Administration and the Solar Energy Industries Association.
Annual New Power Plant Capacity — 2021

For the Third Year Running, Wind Has the Largest Share of New Power Generation Capacity
Wind turbines were the number one electric generation resource built in 2021, with a total of 13.8 gigawatts of capacity constructed. Developers added slightly more wind generation capacity in 2020 (14.3 gigawatts), but significantly less in 2019 (8.9 gigawatts) and 2018 (6.6 gigawatts). Only one offshore wind project was completed in 2021: the Coastal Virginia Offshore Wind pilot project by Dominion Energy. The offshore wind market will need to scale up dramatically to reach President Biden’s goal of 30 gigawatts by 2030.
New wind farms often depend on access to transmission lines. Learn how Utilities Corner the Electricity Market By Controlling Transmission.

Will Residential and Commercial Solar Growth Overtake Gas Plant Construction?
In 2021, added gas and small solar capacity were almost equal; 5.7 gigawatts worth of gas plants were built this year, while developers installed 5.4 gigawatts worth of residential and customer solar. The gap between gas and distributed solar has been narrowing for several years:

Customer-owned solar systems are more popular now than ever. According to the Solar Energy Industries Association and Wood Mackenzie, solar developers installed over 500,000 residential solar projects in 2021. Still, according to research by the Rocky Mountain Institute, the current federal solar investment tax credit has disproportionately benefited wealthier, higher-income, and often whiter households. Changing this incentive to a refundable or direct pay tax credit would help more Americans go solar.
Solar developers also face interconnection delays or other inhibitive policies set by utilities. On this front, there is some good news: thanks to a ruling by the U.S. Ninth Circuit Court of Appeals, utilities may be subject to antitrust litigation for their anticompetitive behavior.
In 2021, ILSR surveyed solar developers across the country to identify issues and challenges facing local solar projects. The findings from these survey responses and interviews are analyzed in a new report: 2021 Local Solar Developer Survey.
Attacks on net metering are also mounting in many state legislatures and utility regulatory bodies. Of note, the California Public Utilities Commission issued a proposed decision that would undercut the distributed solar market. California is the country’s largest market for residential solar.
In Florida, House Bill 741 and Senate Bill 1024 (passed and awaiting the Governor’s signature) aim to dramatically reduce the benefits of net metering to customers.
Despite these hurdles, solar and renewable generation resources are proving to be more cost-effective than fossil fuel generation. After unprecedented numbers of public comments, Xcel Energy dropped its plans to build a combined cycle gas plant in Becker, Minnesota. Renewable energy advocates estimate that the plant would have cost up to $200 million more than clean energy alternatives. The state of Minnesota is also investigating the “future of gas” in regulatory docket 21-565.
The Energy Sector Outlook for 2022
12.8 gigawatts of utility-scale solar generation capacity were built in 2021. Together with distributed-scale solar, 48 percent of generation capacity added in 2021 was solar. Distributed solar, in particular, broke its own quarterly installation record twice in 2021. However, the Solar Energy Industries Association and Wood Mackenzie predict that supply constraints will be more of a hindrance for solar in 2022.
President Biden could ease renewable energy supply chain constraints with the Defense Production Act. Listen to episode 152 of Local Energy Rules to find out more.
Many states and cities have set resolutions to be carbon neutral in two or three decades. If the utilities serving them continue to build new gas plants, each with a lifespan of 40 years, there is little hope for them to reach their goals. ILSR’s 2022 Community Power Scorecard illustrates the tools communities may have to take charge of their energy futures.
Quarterly Power Plant Capacity Update – 2021 Q4
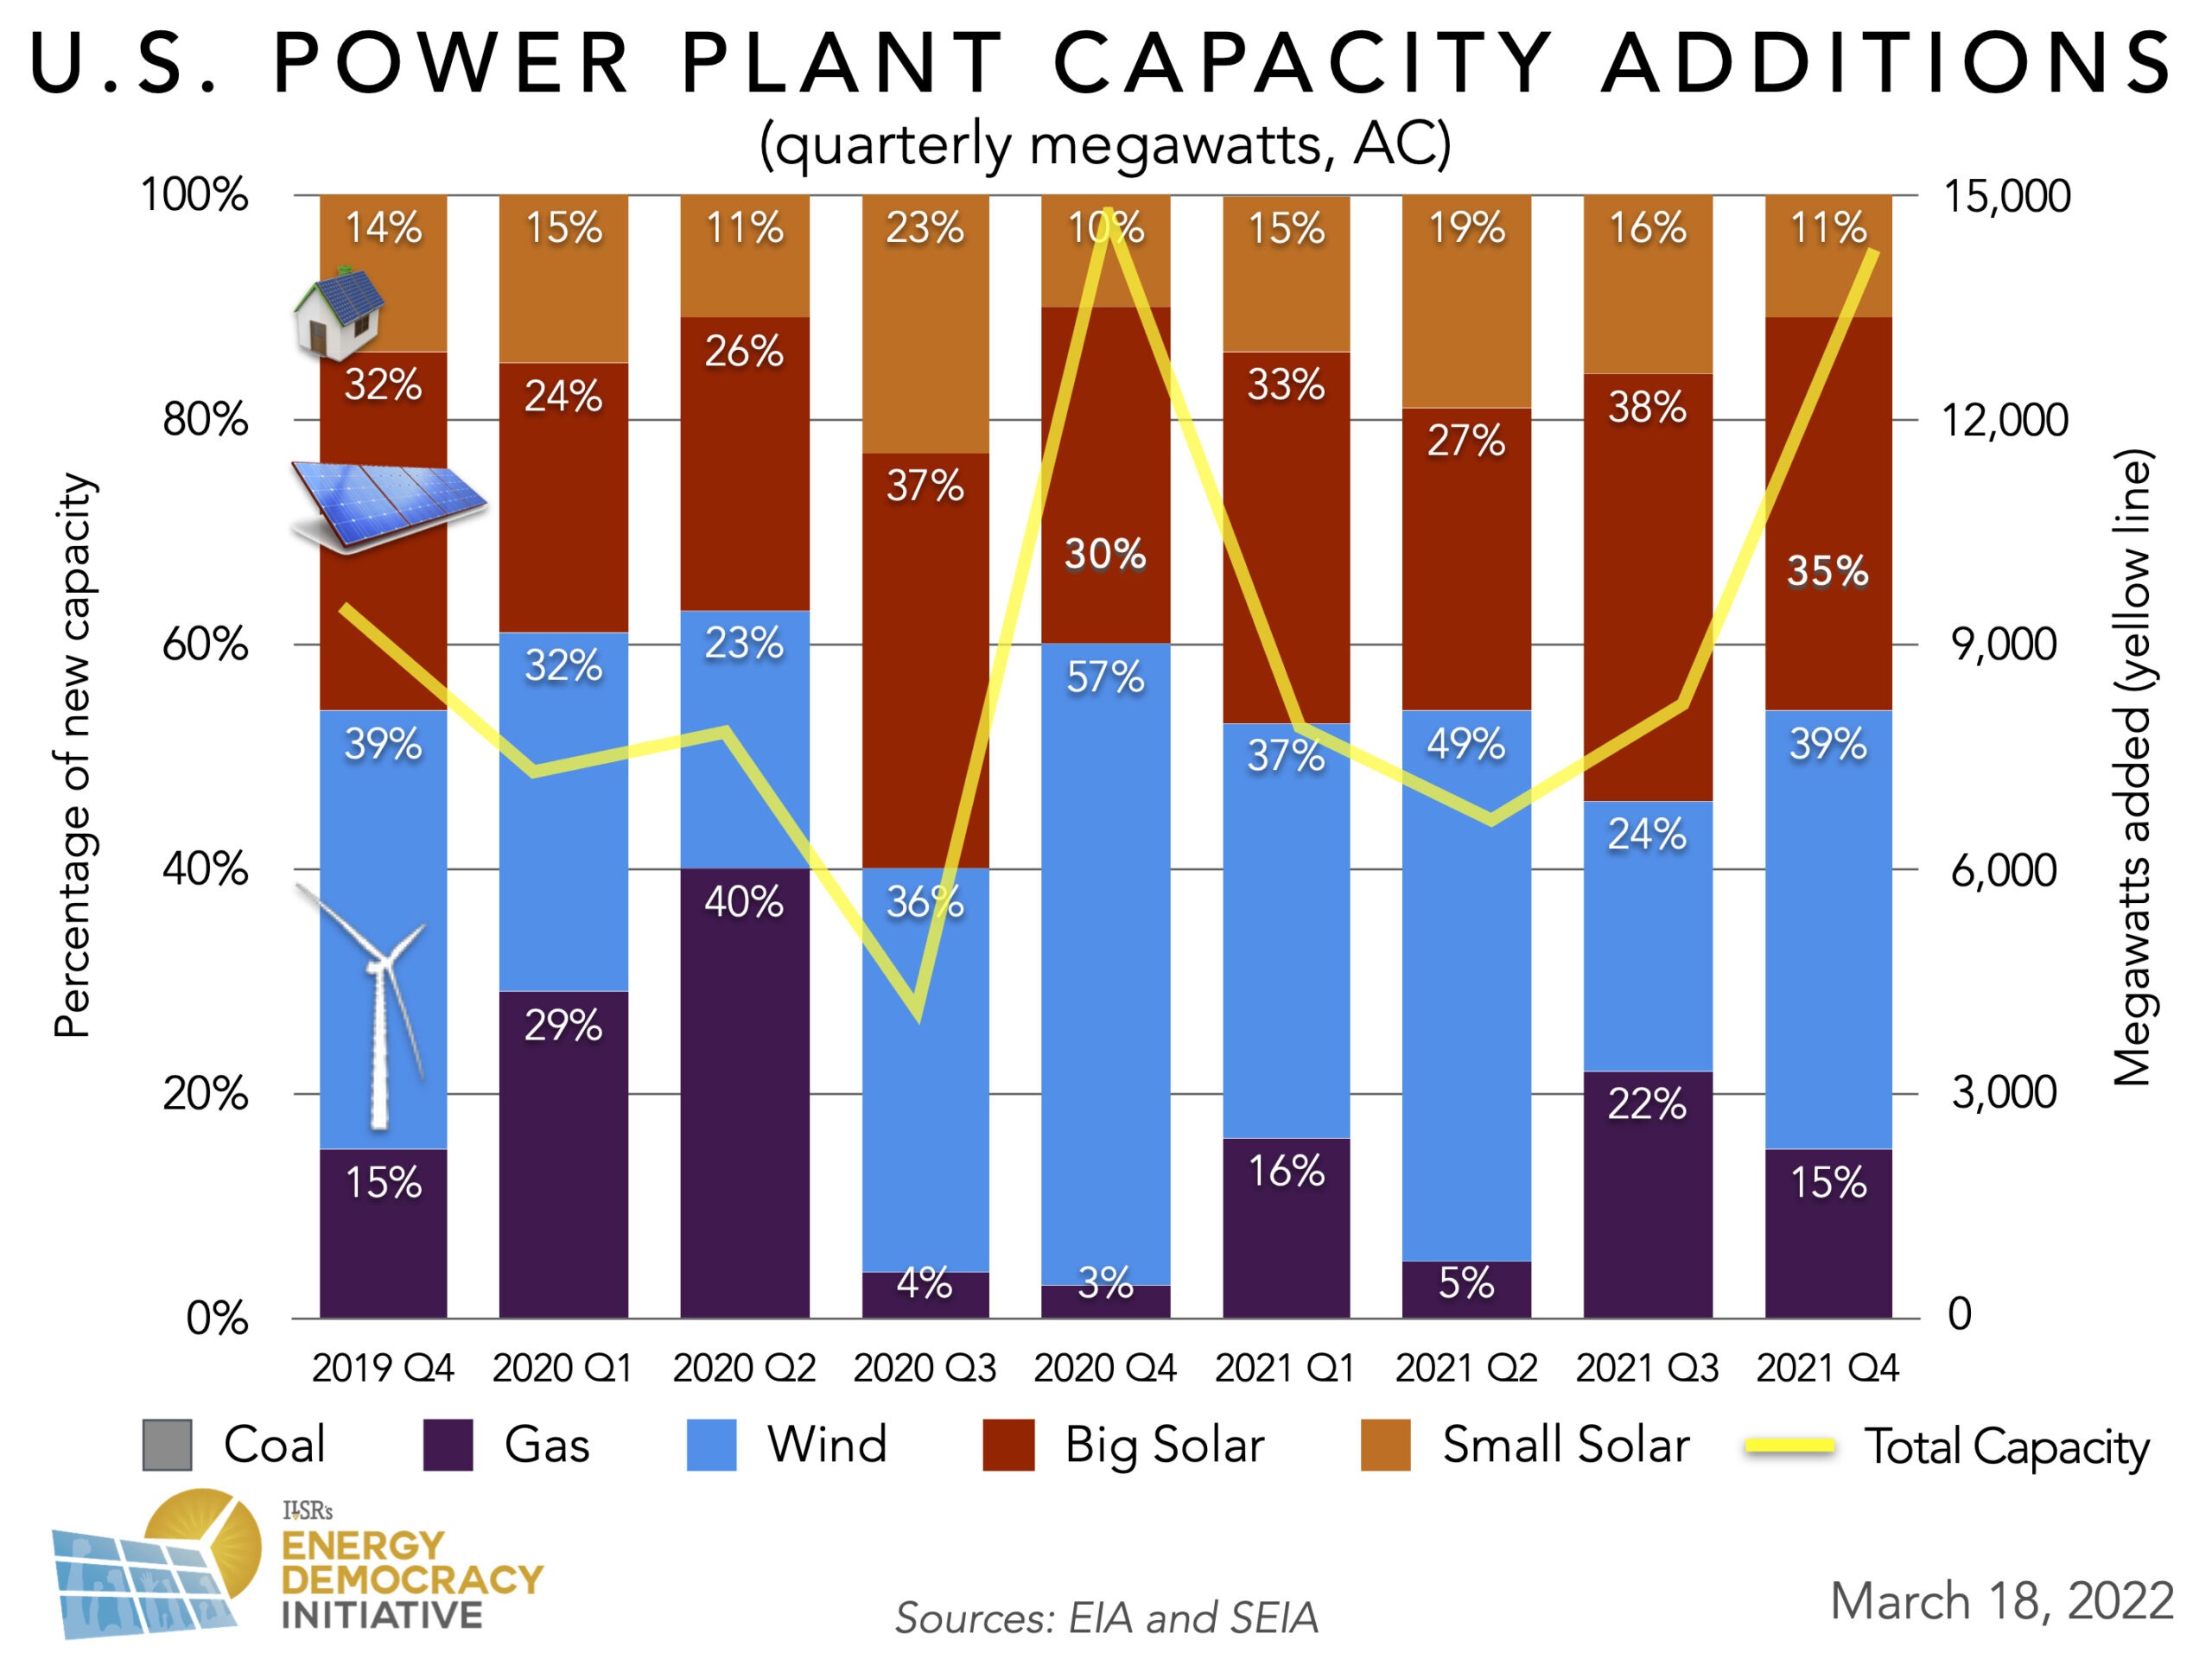
14 gigawatts of new generation capacity came online in the fourth quarter of 2021 — just shy of 2020’s fourth quarter record. The construction of new gas, wind, large solar, and distributed solar resources all ballooned this quarter. In fact, both large and small solar broke their respective records for quarterly growth. Paired with a surge of new wind generation capacity (more than double the capacity added last quarter), renewable resources contributed 85 percent of generation capacity buildout this quarter.
In the chart below, we illustrate the past two years of new power plant capacity in the U.S., disaggregated by energy source on a quarterly basis.

10 More Gigawatts of Large Scale Renewables Are in Service
Although solar did not hold the majority of newly installed generation capacity, more solar panels were interconnected this quarter than ever before. The fourth quarter has traditionally been the strongest quarter for solar development. In total, developers installed 6.6 gigawatts of solar this quarter. Five gigawatts of that total were from large-scale solar, a new quarterly record.
Developers installed 5.5 gigawatts of new wind generation capacity in the fourth quarter of 2021. Though it is an impressive amount, it did not set a record — 8.5 megawatts of wind generation capacity were built in the fourth quarter of 2020.
Another Record Quarter for Distributed Solar Growth
Despite continued supply chain delays, 1.6 gigawatts of distributed solar capacity were installed in the fourth quarter of 2021 — breaking the record set last quarter. The demand for residential solar is high, and if the federal government extends or tweaks the federal investment tax credit, it could be even higher.
Find out how Tweaking a Tax Credit Could Help More Americans Go Solar.
Community solar programs in New York and Massachusetts progressed by leaps and bounds. Unfortunately, Minnesota’s once-leading program has stalled as portions of the grid reach their maximum hosting capacity and developers face interconnection delays.
Gas’s Strongest Quarter of the Year is Historically Average
The fourth quarter of 2021 was the biggest of the year for gas plant construction, with 2.2 gigawatts of capacity coming online. Though this is more new gas capacity than was added last quarter, gas plants only made up 15 percent of this quarter’s power plant capacity additions. In a quarter that was strong for all generation types, gas had a comparatively weaker showing.
Interested in earlier trends and analysis of new power plant capacity? Check out our archive, illustrating how electricity generation has changed in previous quarters and years.
This article originally posted at ilsr.org. For timely updates, follow John Farrell on Twitter or get the Energy Democracy weekly update.
Featured Photo Credit: U.S. Department of Agriculture via Flickr (CC BY-ND 2.0)


