Round 3 of Minnesota’s stakeholder process on the value of solar power (10/15/13) focused on the remaining unresolved tensions between stakeholders, and it started with a reminder of the charge, with quotes from the enabling law.
A utility may apply to the Public Utilities Commission for a value of solar tariff that compensates customers through a credit for “the value to the utility, its customers, and society.” The methodology for calculating the value of solar must include the “value of energy and its delivery, generation capacity, transmission capacity, transmission and distribution line losses, and environmental value.” It may also include – “based on known and measurable evidence of the cost or benefit of solar operation to the utility…credit for locally manufactured or assembled energy systems, systems installed at high-value locations on the distribution grid, or other factors.”
Following Minnesota’s Value of Solar Process? Here are a few resources:
- Part 1 and Part 2 of my series of posts on the process
- My comments to the Department of Commerce on value components to include (PDF and slideshow)
- Live tweets and context with Twitter hashtag #MNVOST
- The Department’s value of solar stakeholder resource page
- The enabling law (see Sec. 10 and following) – HF 729
That means there are two tiers in the value of solar calculation:
- Tier 1 – the required elements (energy, delivery, capacity, losses, and environmental value) measured broadly: their value to the utility, its customers, and society
- Tier 2 – the optional elements (local manufacturing, high value locations, other) measured narrowly: their value based on known and measurable evidence of the cost or benefit to the utility
As we’ll see a bit later, the state’s largest utility is interested in conflating these two categories to narrow the value of solar energy.
Xcel Energy’s Double-Talk on Fuel Hedge
Xcel Energy led off the conversation about the value of solar, and they estimated the value of solar between 5.5¢ and 8.8¢ per kilowatt-hour, significantly less than solar producers get from retail rates under net metering (10-11¢ for residential customers).
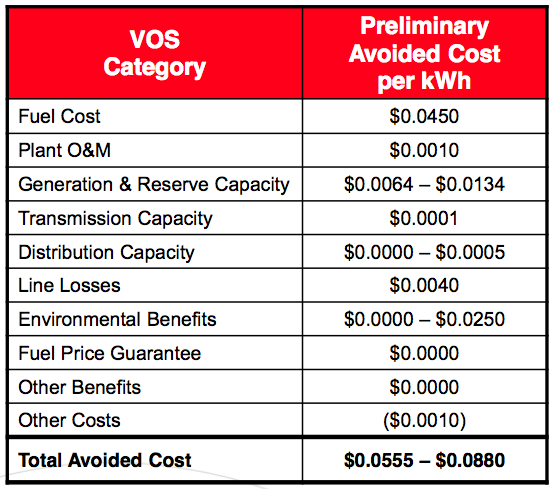
The jaw-dropping line item was that solar would offer $0 value as a fuel price guarantee, despite estimates in other utility jurisdictions of between 2¢ and 4¢ per kilowatt-hour.
Xcel was also caught testifying just three days later that, when concerning its nuclear power plant, non-fossil generation (like solar…) did provide “a valuable hedge against potential increases in fossil fuel costs” which have been “extremely volatile.”
Utility a Hypocrite on Environmental Value, Too
In contrast to the range provided in the above chart, Xcel’s spokesperson clarified in their spoken testimony that the utility did not see any “known and measurable” environmental value of solar. Two issues were at play in that statement.
First, the utility was trying to conflate the scope of Tier 2 values of solar (narrowly defined as utility cost/benefits) with a Tier 1 value (environmental) that the law expressly states must be evaluated on the basis of value to the utility, its customers, and society.
The second issue was more two-faced talk from the utility. Just three days later, Xcel revealed that it did find environmental value in non-fossil resources, but again only with regard to their (massively over-budget) nuclear power plant. Xcel claimed that their nuclear plant would save ratepayers $175 million over 16 years, but only because of the value of avoided carbon dioxide emissions (worth nearly $500 million).
Arguments for More Robust Values
A collaboration of several energy and environmental organizations with experience in distributed solar provided some badly needed context for the contested values of solar. Some of the highlights:
- Overall: A study conducted by the same contractor retained by the Department (Clean Power Research) in Northeastern states provided a good model and methodology for the required and optional components. The value of solar (based on the required components in MN state law) would land between 10¢ and 15¢ per kilowatt-hour, much higher than Xcel’s estimate.
- Avoided fuel cost: gas price projections are best [and probably futures contracts rather than EIA projections, which have a terrible record]
- Avoided operations and maintenance costs: use the energy prices from the MISO market
- Fuel price hedge: NOT ZERO. The value should reflect the differential in price required to guarantee natural gas prices for 25 years (since solar has zero fuel cost over that time period). Since it’s not possible to get a 25-year supply contract for natural gas, this value must be non-zero.
- Avoided transmission costs: use the MISO transmission prices posted on OASIS, and not based on the incremental cost of new transmission
- Environmental: the value should be calculated based on the variety of avoided environmental ills, including nitrogen dioxide, sulfur oxides, particulate matter, and greenhouse gas emissions (based on the social cost of carbon). Renewable energy credits/certificates (RECs) are NOT an environmental value, but represent the value of compliance with a state or federal law.
- Economic activity: The economic benefits of solar are known and measurable and the utility benefit (sales revenue, local taxes) should be included.
- Voltage control: Maintaining a constant voltage (110V) on the distribution grid is a valuable service for utilities (paid for in competitive markets in certain parts of the U.S.) and should be included
- Market price reduction: A surge of renewable energy on the grid has reduced wholesale energy prices for all customers in Germany and Ohio, and even if it’s an impact that won’t be seen in the short run, it should be included.
- Disaster recovery: calculate “security enhancement value” from PV that can help mitigate system outages during peak demand using methodology from Clean Power Research study or a bottom-up approach.
The Department’s Team Clarifies Two Key Values
Before the day wrapped up, the Clean Power Research team was up to clarify their approach to two key components, the value of capacity on the distribution grid and the fuel hedge value.
How Solar Reduces Infrastructure Costs
Installations of solar on a distribution feeder (think the power lines in your alley or along your street) can help defer upgrades to the local electric grid by reducing overall demand. The dollar value to utilities is essentially the time value of money (e.g. the interest they could earn investing the money elsewhere instead of buying new transformers or upgrading substations). The following graphic illustrated the proposed approach by Clean Power Research (and hence, the Department).

The original grid investment plan (1) was to upgrade when the demand curve (top red line) hit the solid blue capacity line (1a). But new solar PV installations help reduce demand on the grid (2), which means it takes longer for the local demand to hit capacity (2a). This allows the utility to defer their investment in new hardware (3), and that money can be put to use – profitably – somewhere else in the meantime.
The one caveat mentioned is that this savings potential from solar is “lumpy,” meaning that a certain chunk of solar (e.g. 1 megawatt) may need to be installed before the grid investments can be deferred.
Solar’s Guaranteed Fuel Value
Clean Power Research also covered the issue around fuel savings, combining the savings on buying fuel and the hedge value of having solar into a single calculation. It got rather detailed, but here’s the step-by-step:
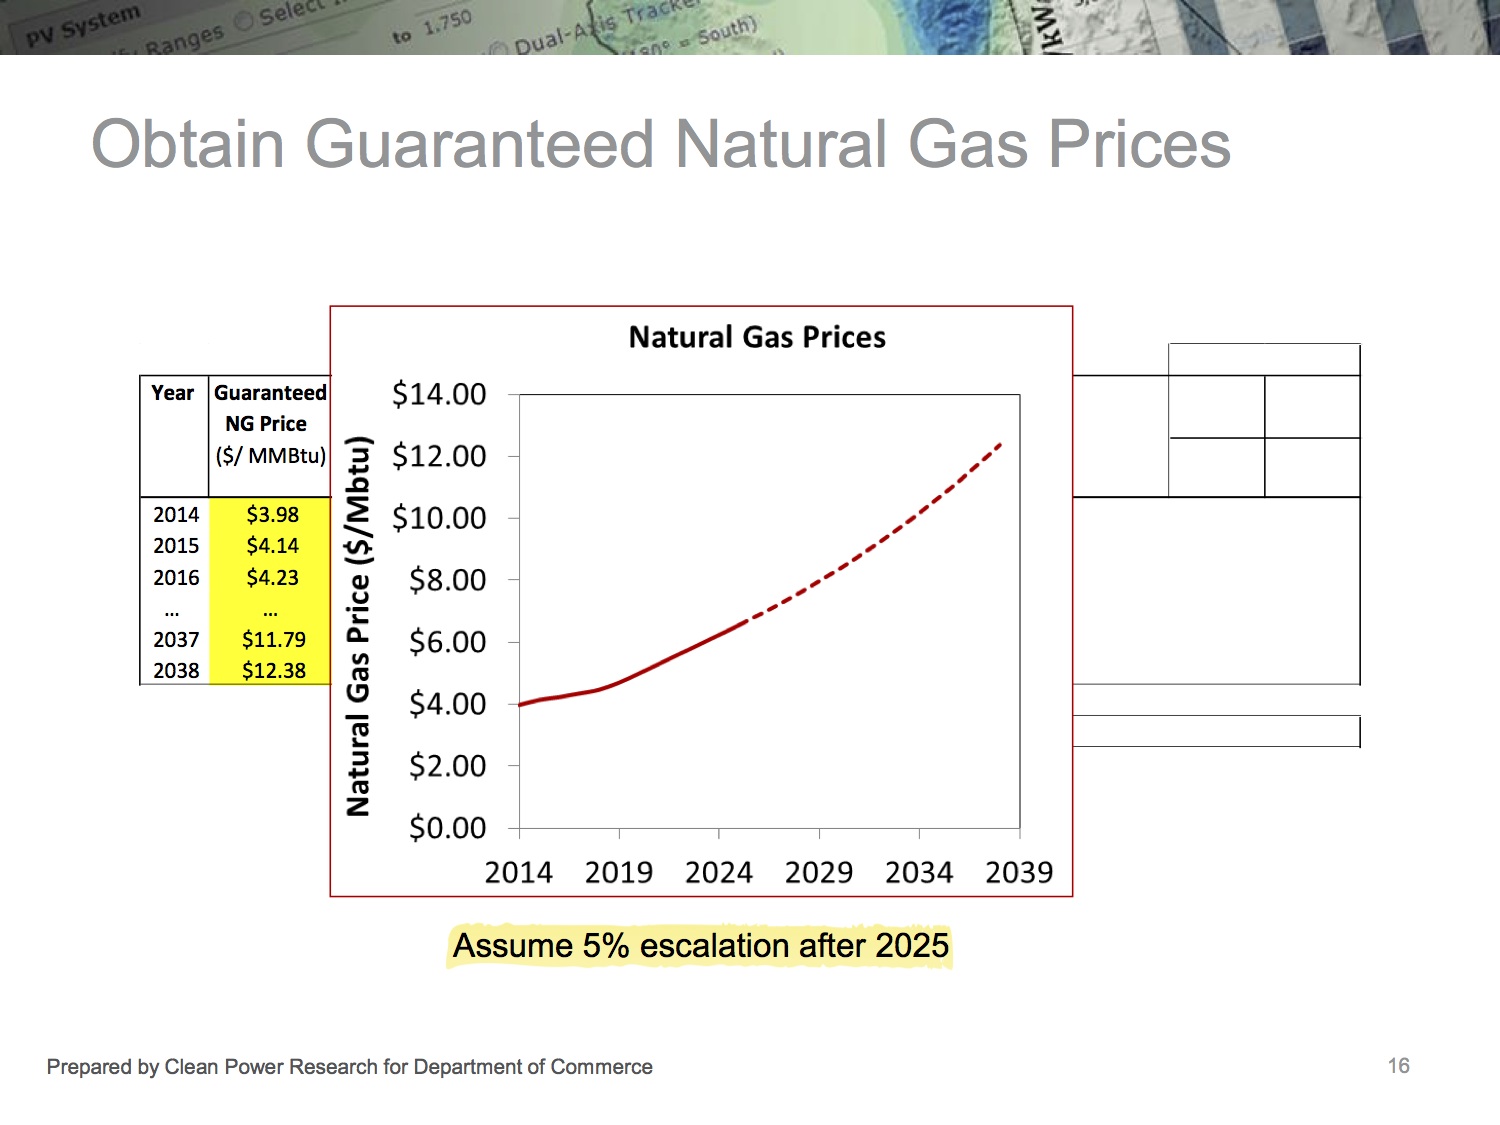
- Decide your expected cost of natural gas. Use futures contracts for as far out as they are available (2022) and then a cost estimate thereafter (e.g. 5% increase per year). This is your guaranteed fuel cost.
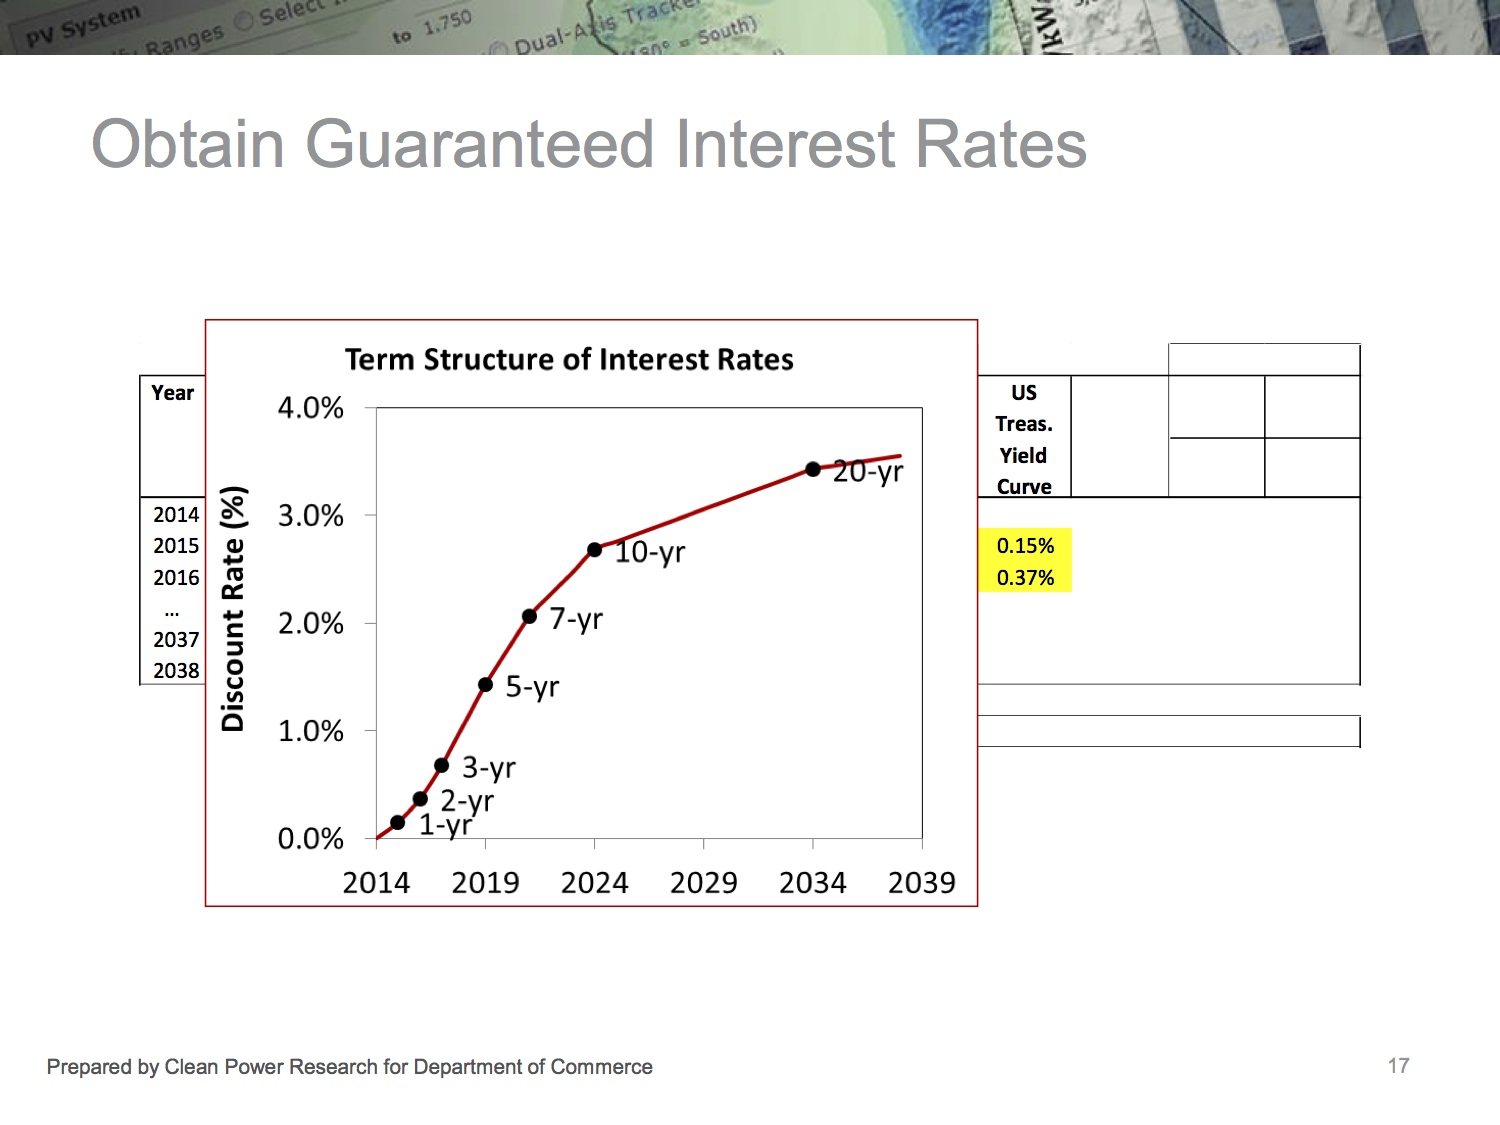
- Determine guaranteed interest rates in that time frame, preferably from U.S. treasuries (the gold standard, at least until our government defaults). This gets us the time value of the cost of that fuel.
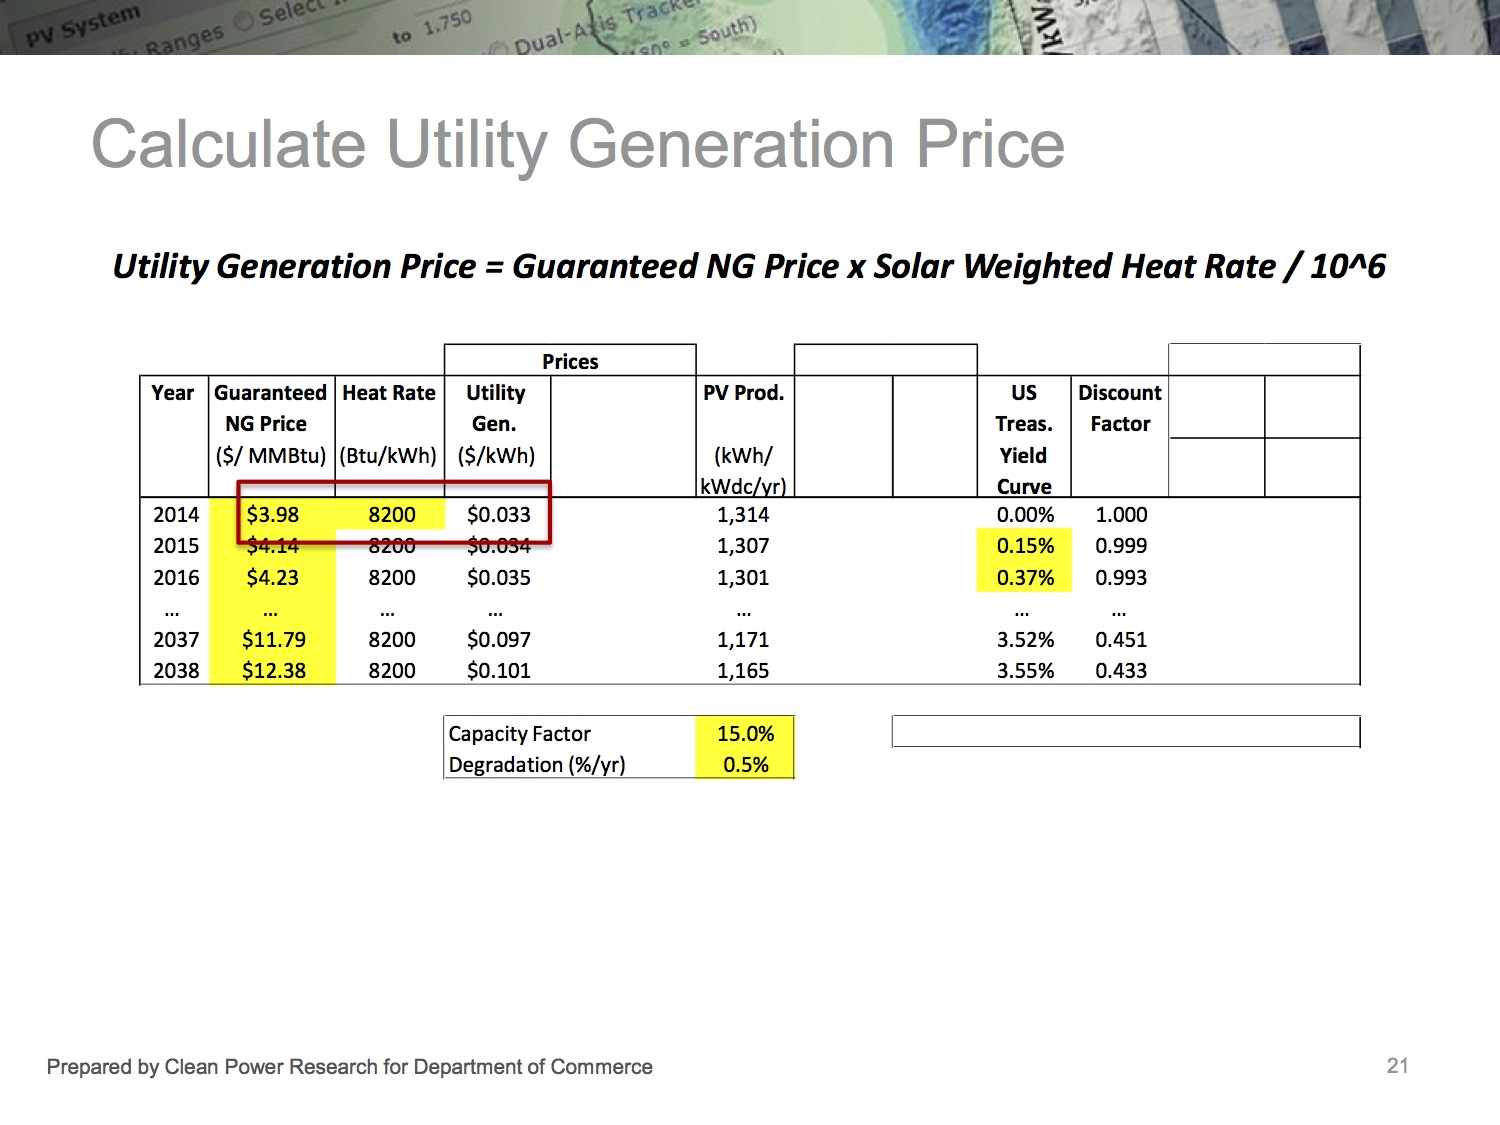
- Then we calculate the “heat rate,” which is a fancy way of saying “how much natural gas do we burn per kilowatt-hour of electricity?” This tells us how much natural gas is avoided when we replace it with solar energy. In the illustration, it was 8200 btu of natural gas per kilowatt-hour of energy.
- We estimate how much solar PV produces in Minnesota (1314 kilowatt-hours per year for every installed kilowatt (DC), decreasing by 0.5% per year)

- Now multiply the guaranteed natural gas price by the heat rate to get the cost of generating power in each year.
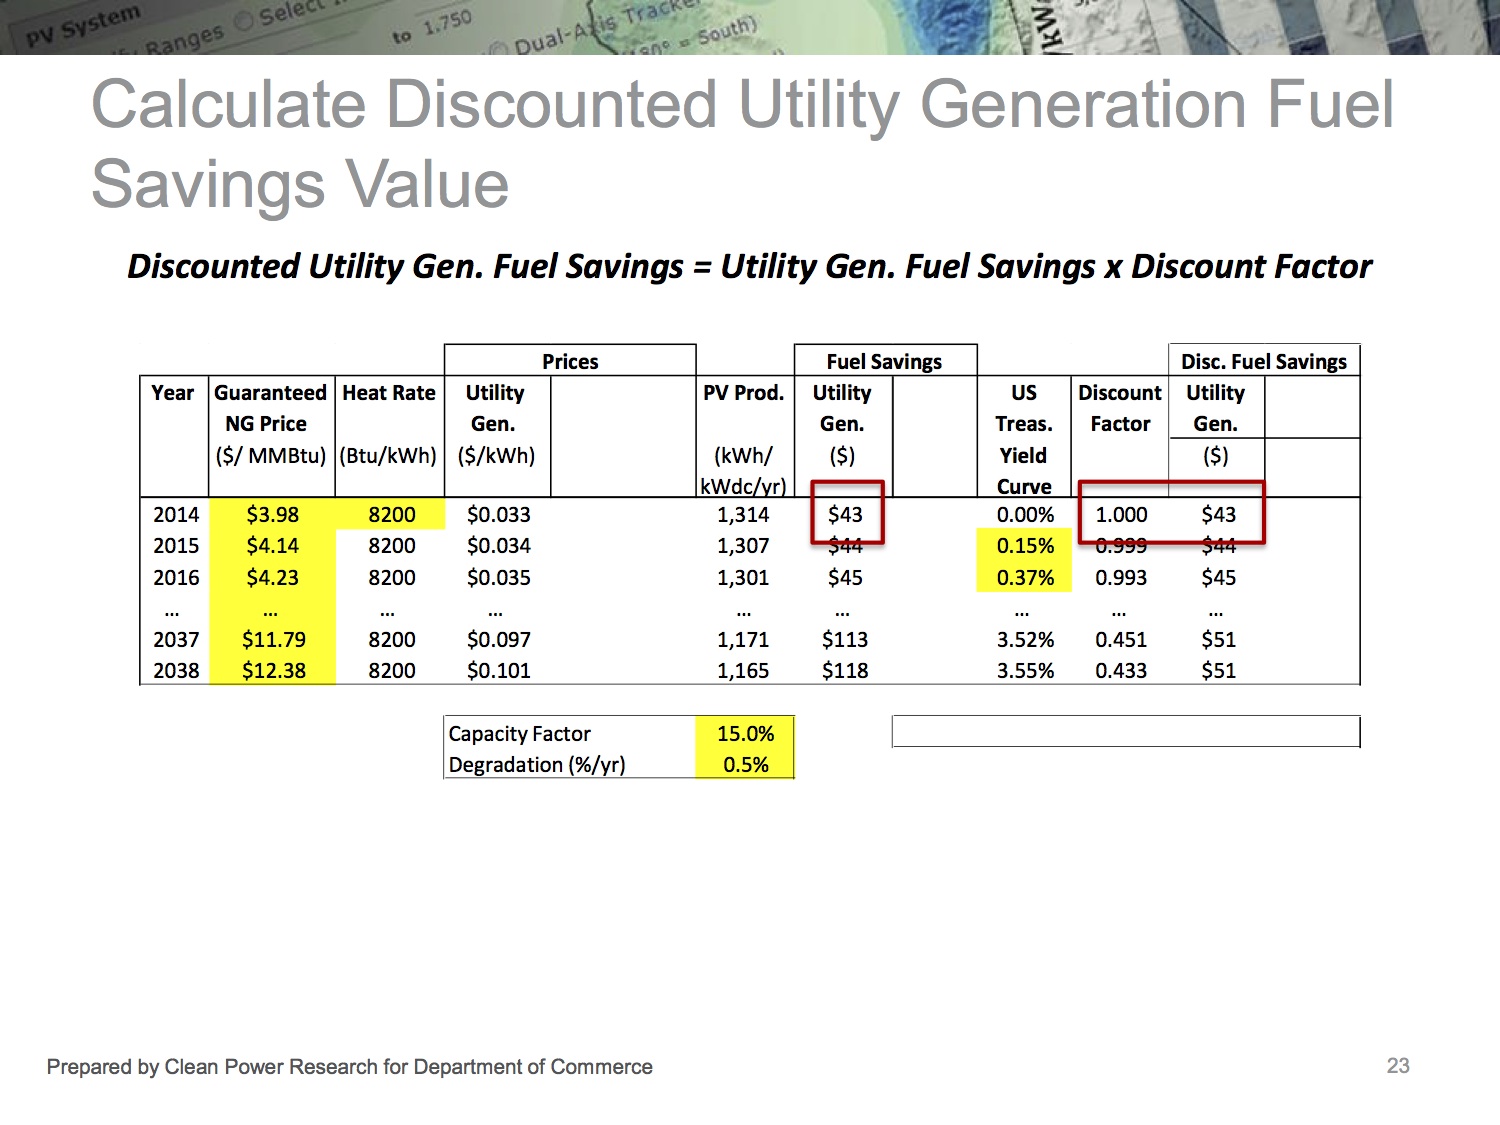
- This allows us to calculate the fuel savings, based on the number of kilowatt-hours produced by a solar array each year.

- We adjust this by the interest rate, to get the present value of this fuel savings each year.
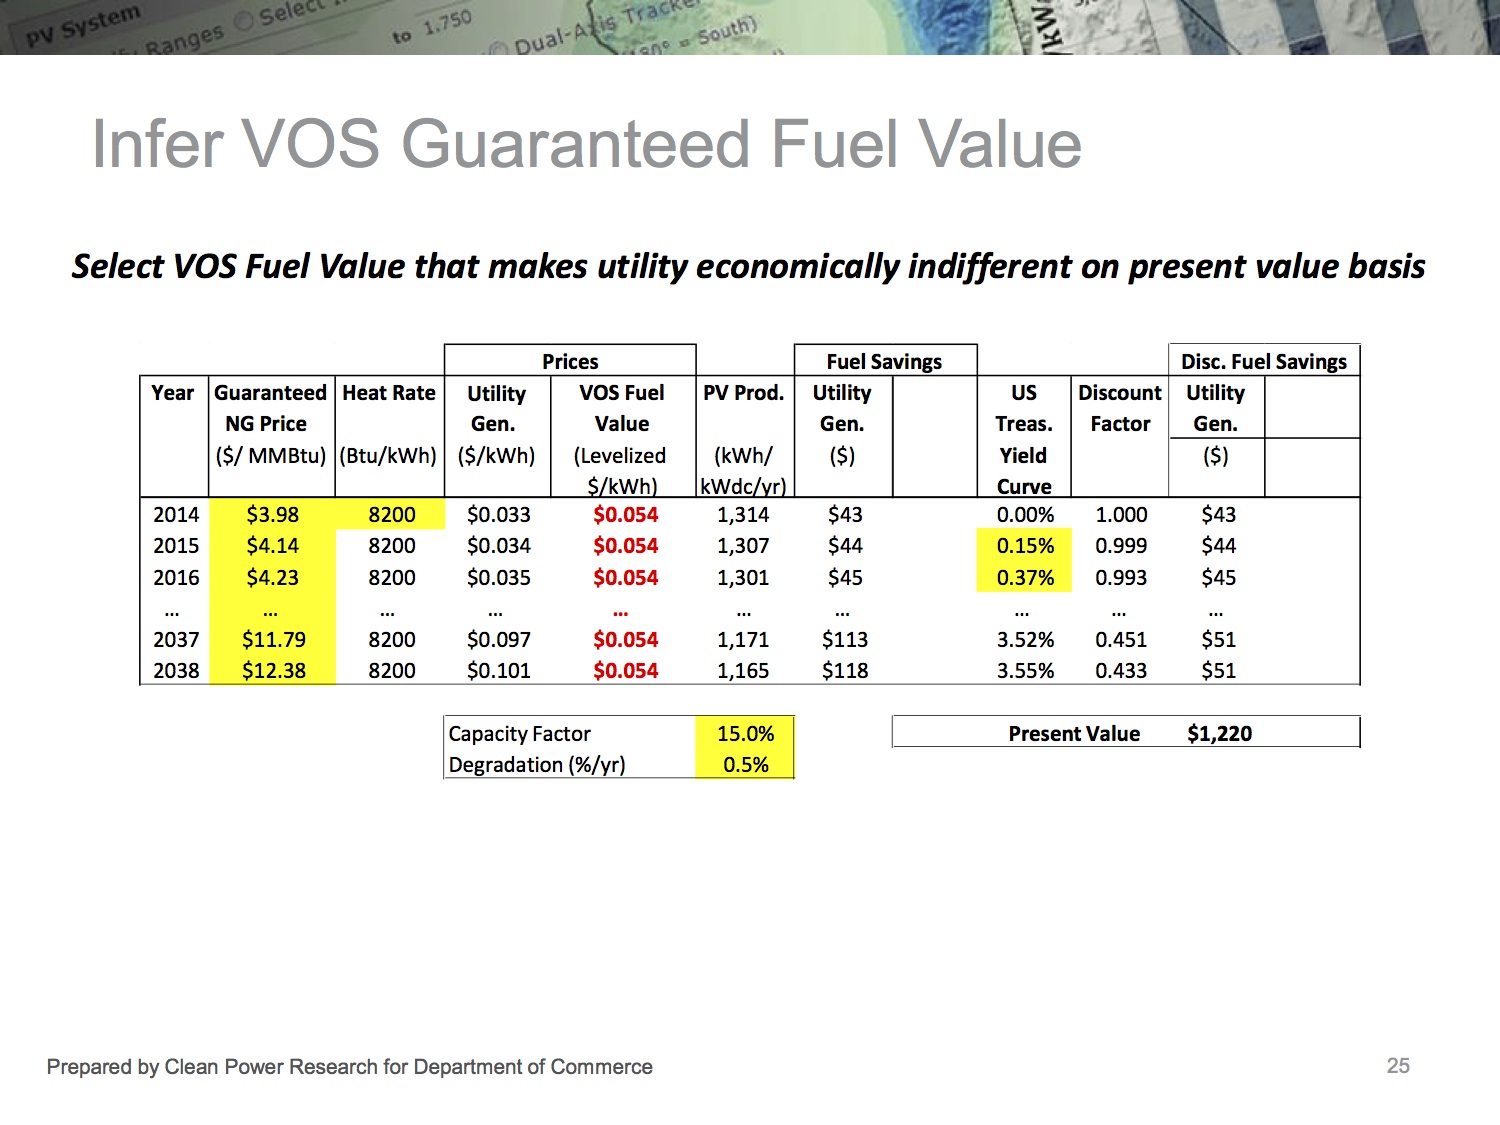
- We sum this up ($1220 in the example) and divide by the total output of the solar array over 25 years to get the guaranteed fuel value from the value of solar (5.4¢ per kilowatt-hour in this example)
Next Steps for MN’s Value of Solar
The Department is going to developed its draft methodology approach, and present it to stakeholders on November 19th, 2013. I’ll be in attendance and live-tweeting (hashtag #MNVOST). Comments on the draft methodology will be due on December 10.
![]()
![]()
![]()
![]()