
![]() This post was originally published on December 13th, 2017 at MuniNetworks.org.
This post was originally published on December 13th, 2017 at MuniNetworks.org.
Update 12/22/2017: Original maps generated on December 11th and used for these fact sheets understated the population of Americans forced to obtain services from known network neutrality violators. The problem is even greater than we originally calculated. We’ve update our maps and our fact sheets to reflect the more accurate data.
Network neutrality protects Americans from the ability of powerful ISPs to exercise unchecked power over what subscribers access and how quickly they receive certain content. The neutral characteristic of the Internet is one of its finest qualities. If Republican FCC Commissioners and Chairman Ajit Pai vote to shred network neutrality on December 14th as they’ve indicated, 177 million Americans will be left to the whims of a flawed market.

 Mapping It Out, Presenting The Fact (Sheets)
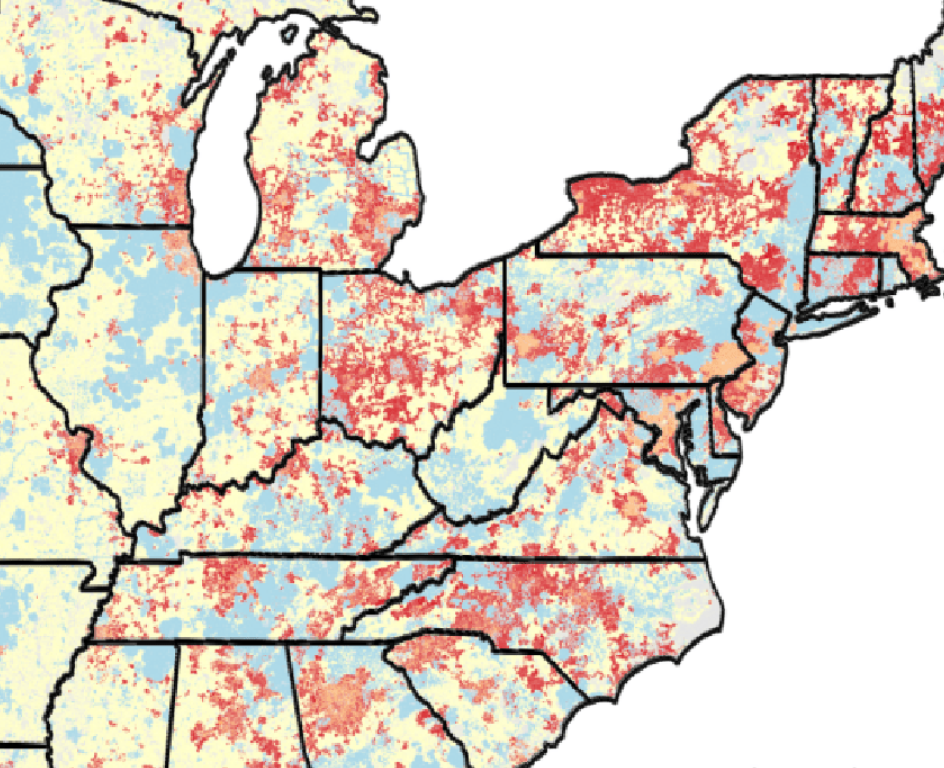
We recently presented visualizations based on FCC Form 477 data that supports our findings on the way the repeal will limit vast swaths of people to a bleak Internet access future. Nationwide, approximately 29 million people have no broadband Internet access. Another 129 million will have no ability to change Internet access providers because there is no other option. Out of those folks, 48 million are forced to take service from an ISP that is a known network neutrality violator. Likewise, 146 million may have a choice between two ISPs, but about 52 million must choose between two network neutrality violators that have actively worked to undermine the policy for years.
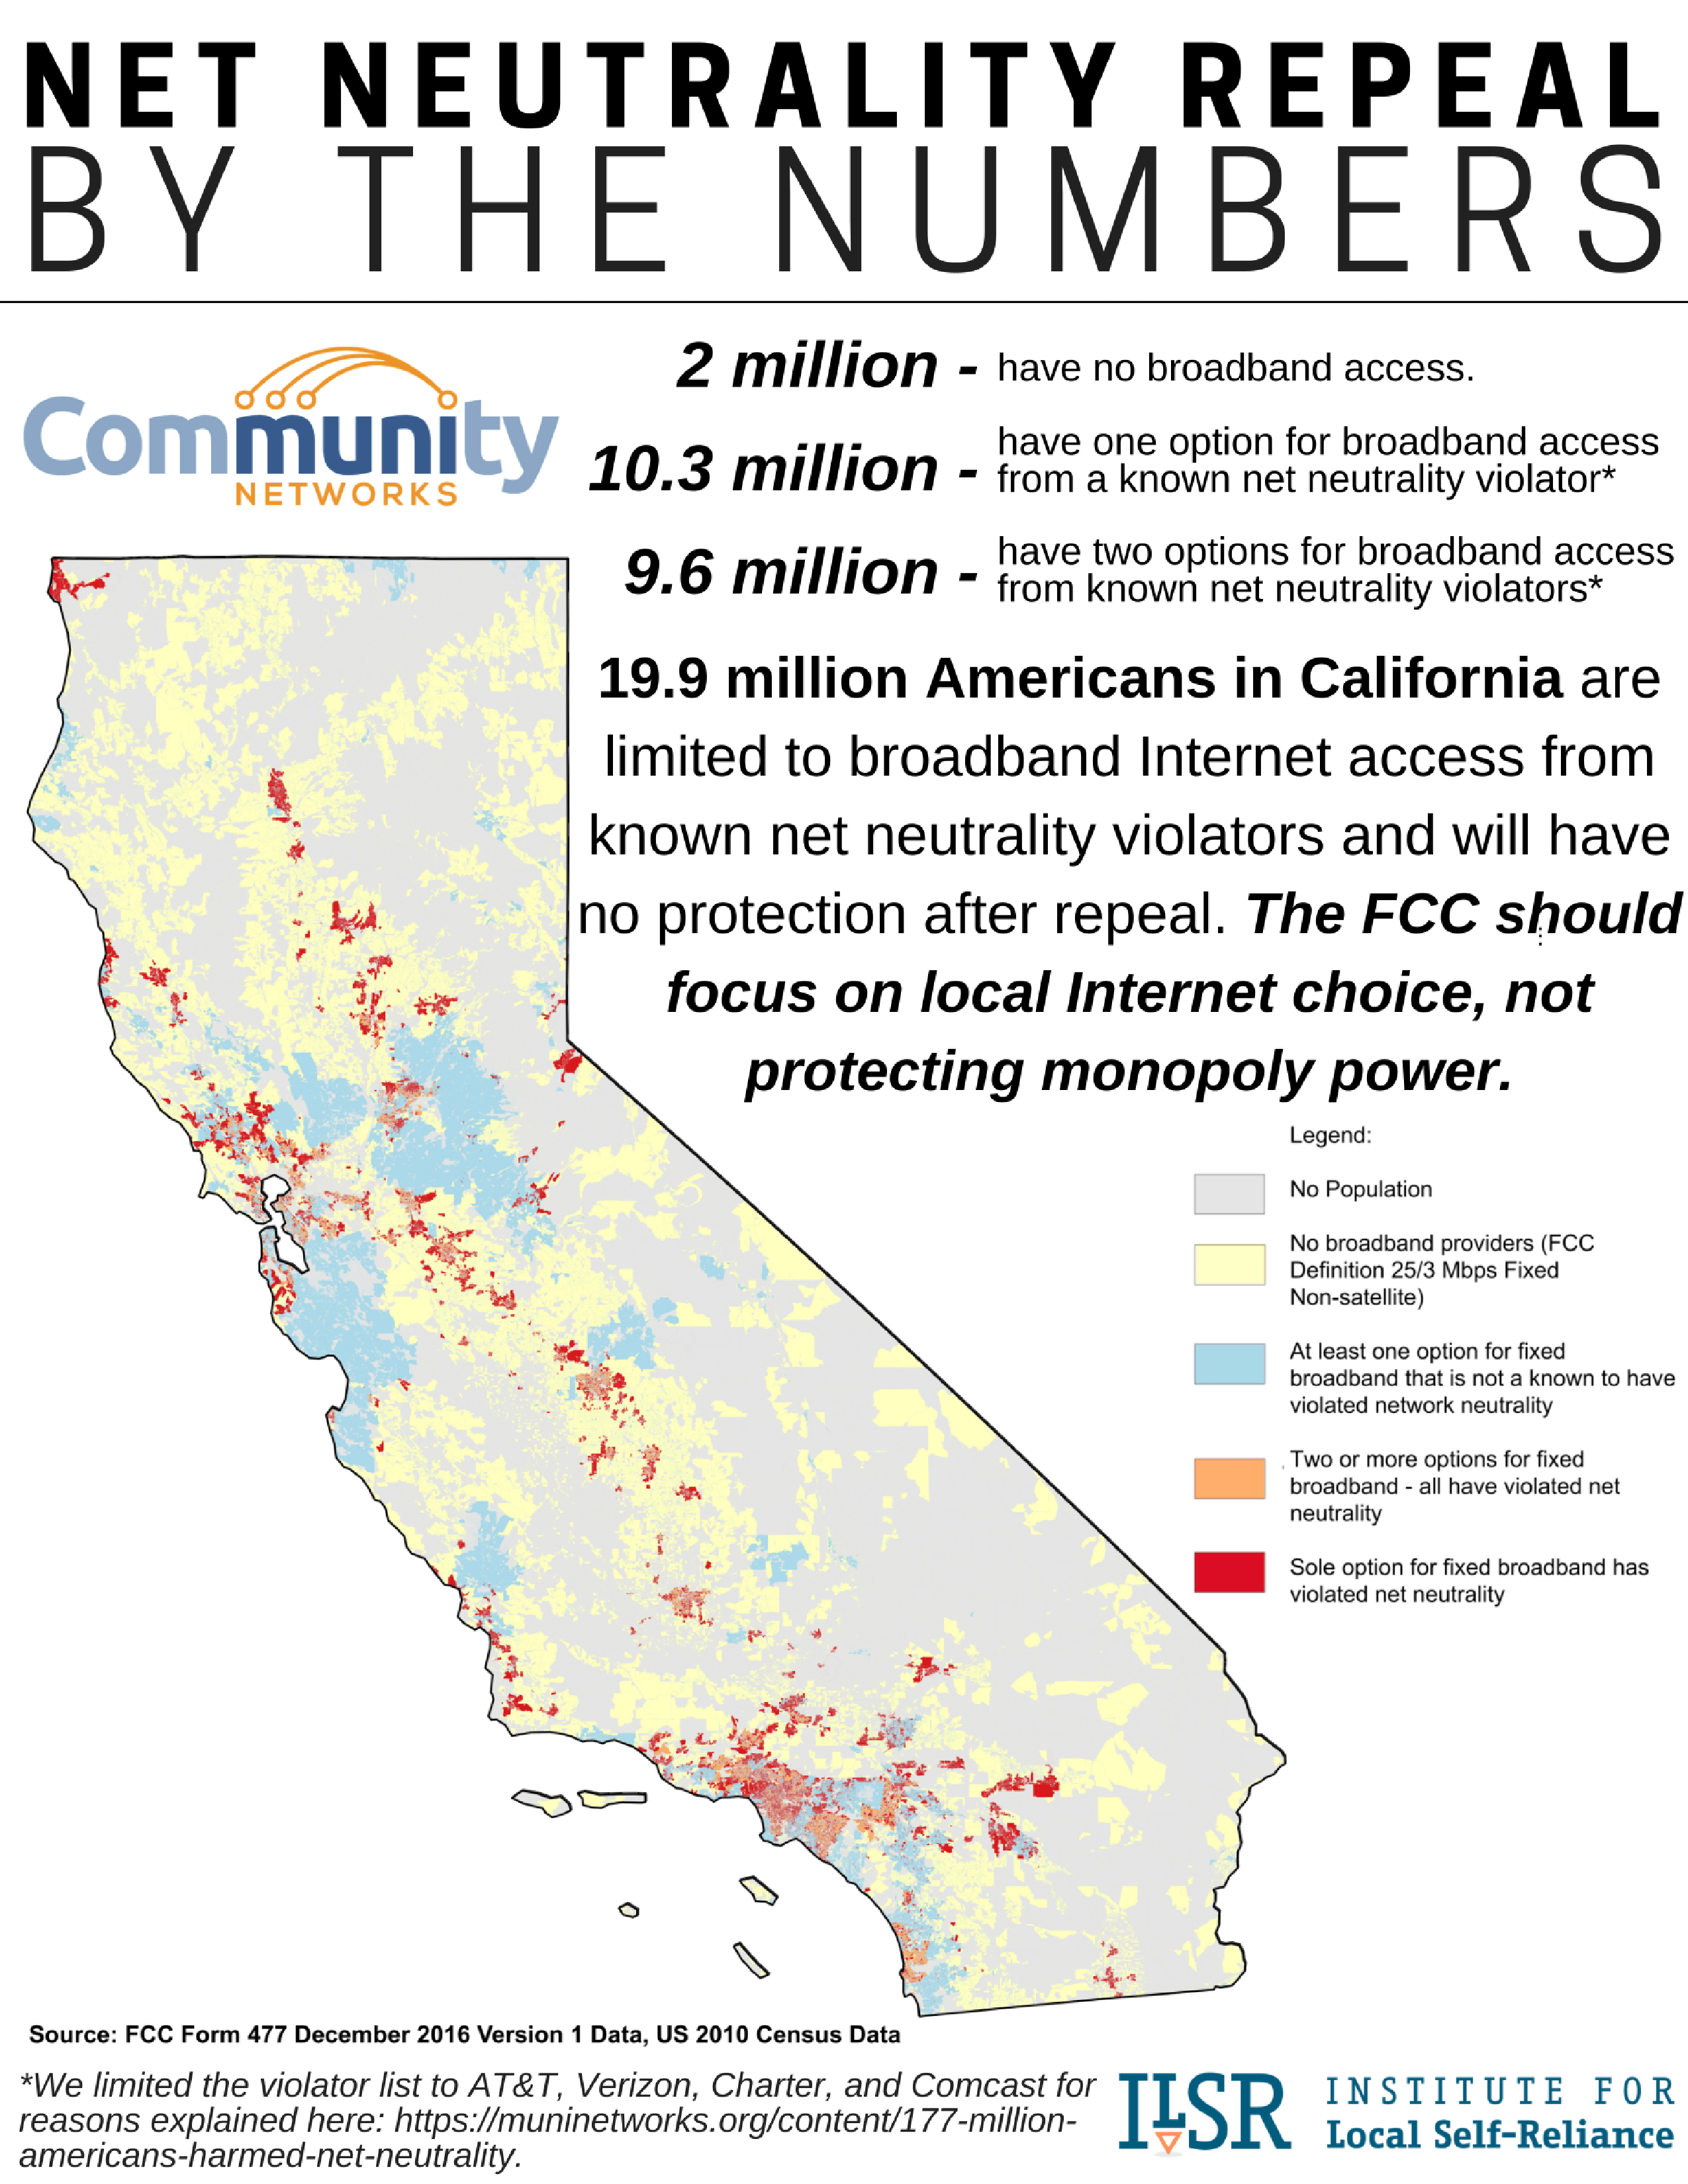
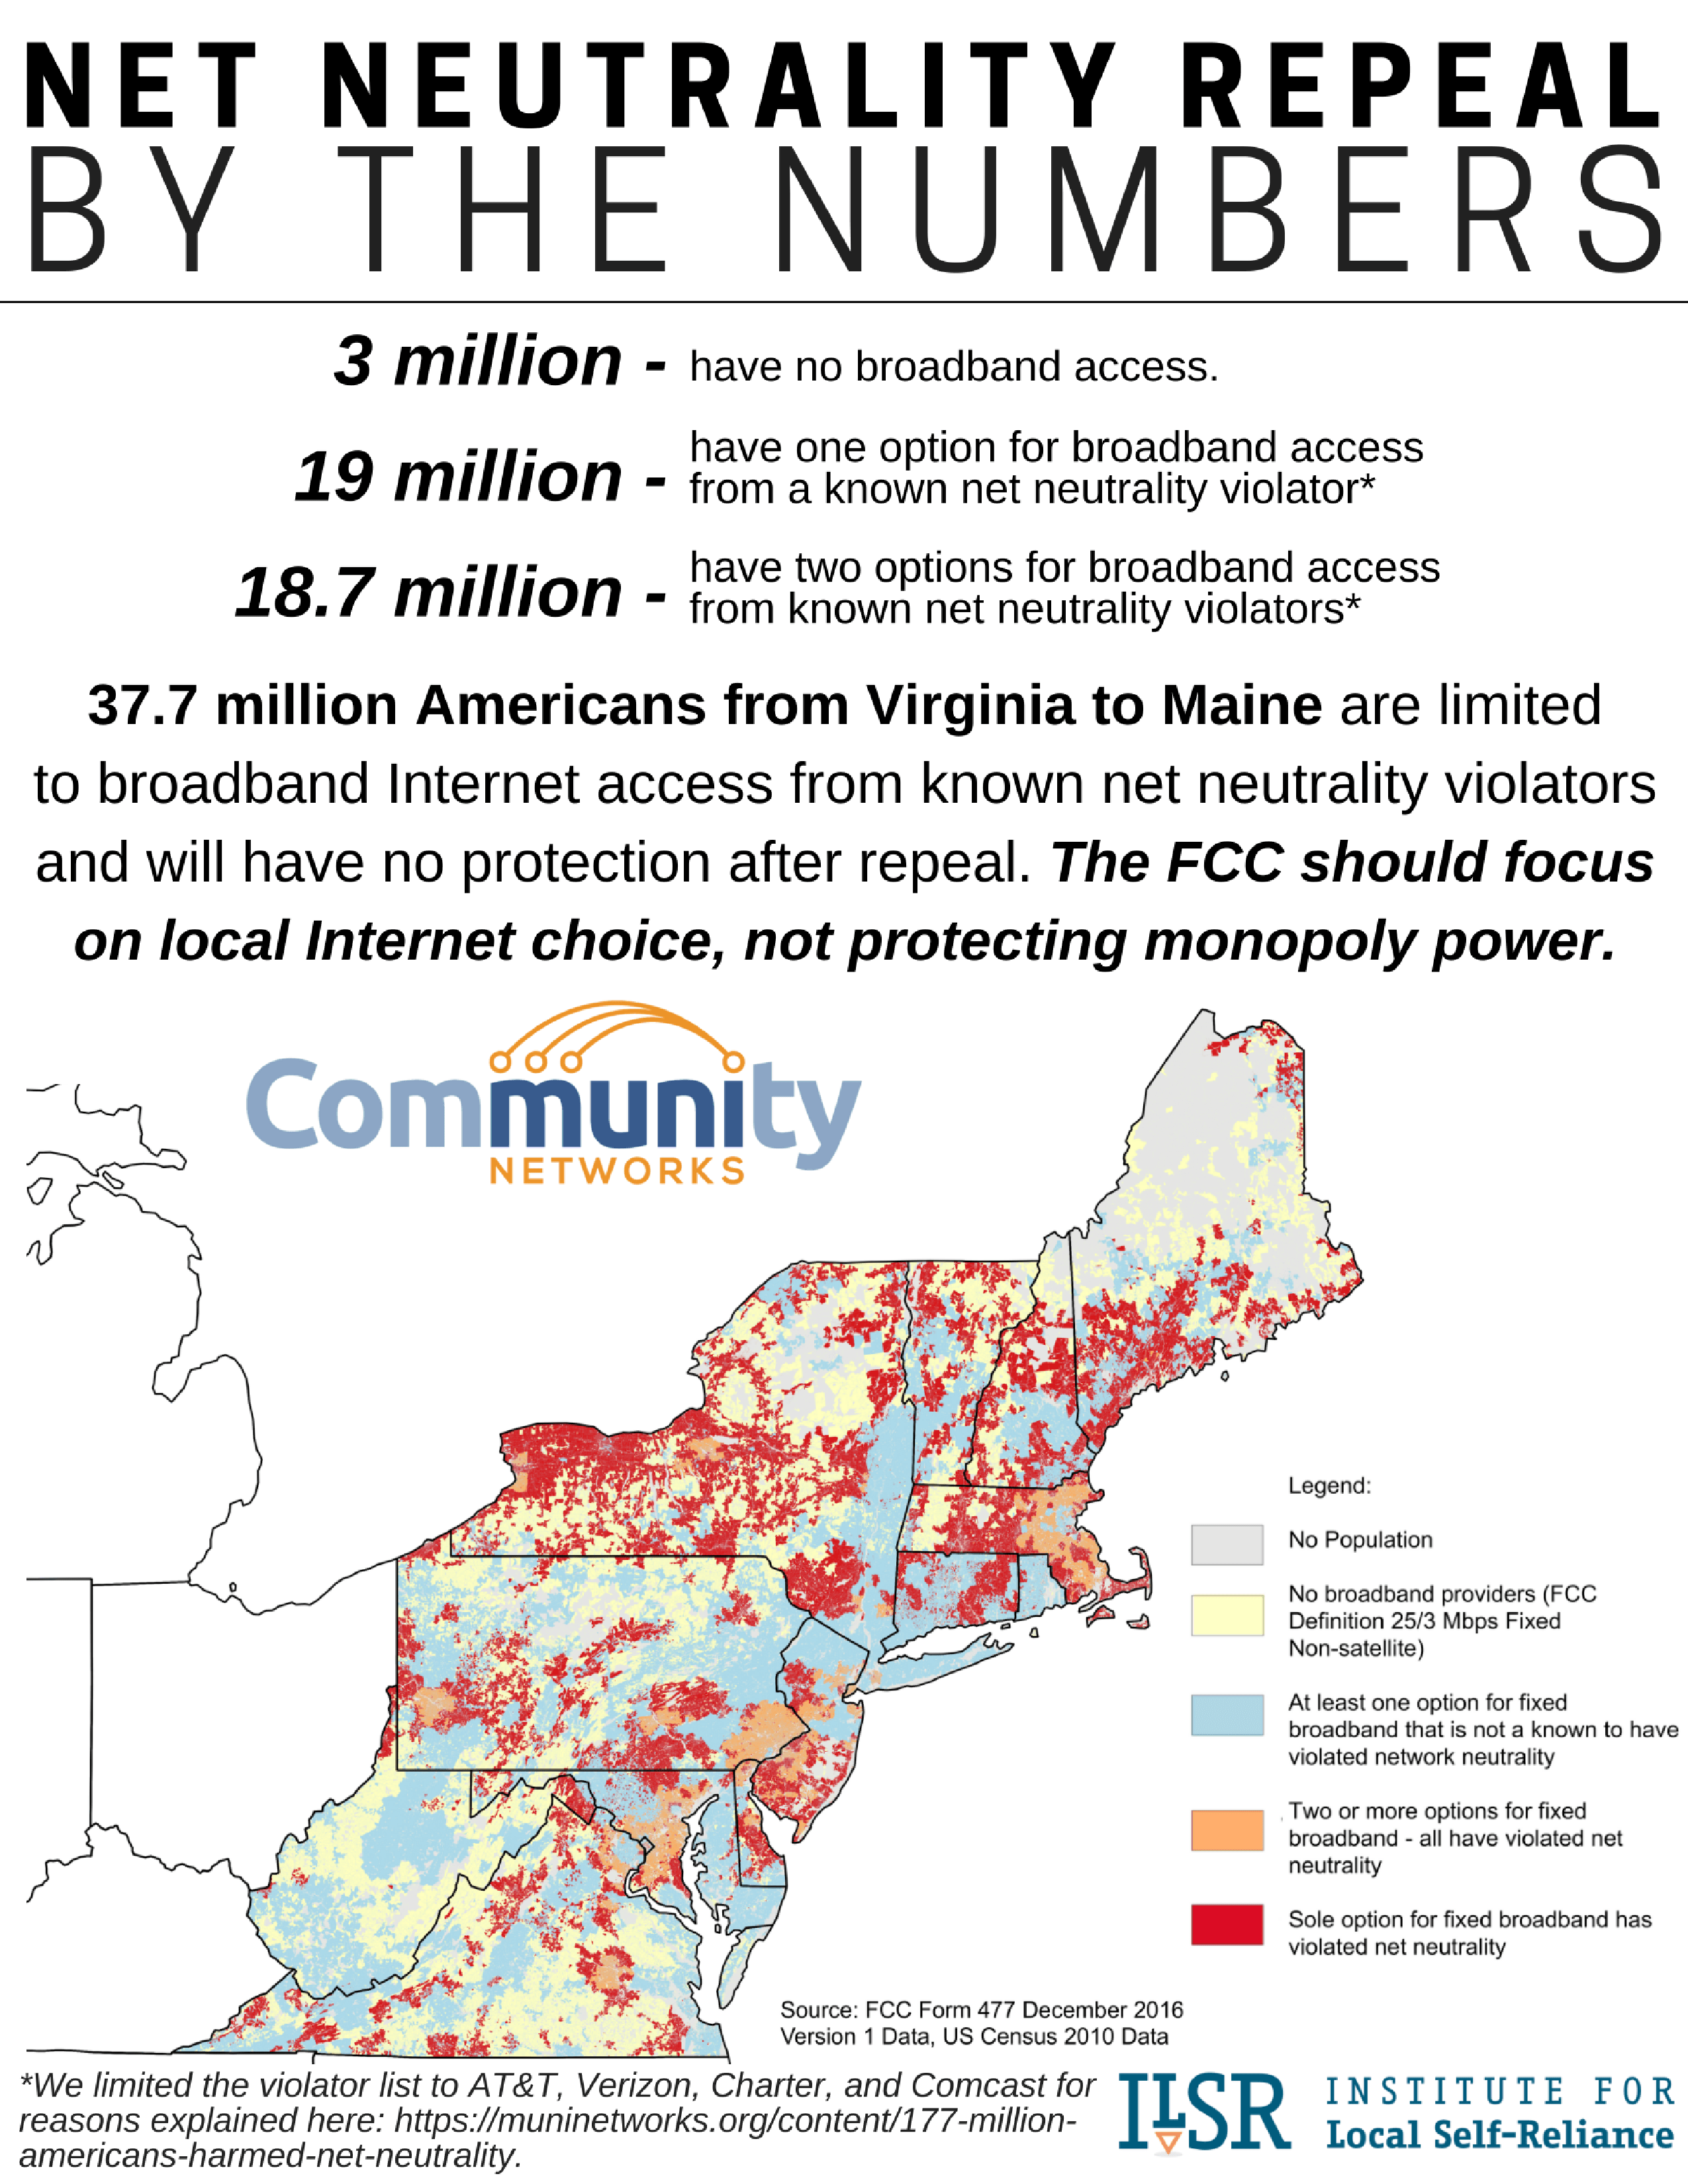
Our team also parsed out the numbers for California and the East Coast from Maine to Virginia. The results are just as discouraging.
In our fact sheets, we focused on the number of people who either have no broadband access or who will be forced to take service from a firm that is a known violator of network neutrality. We’ve included our maps to help illustrate just how pervasive this problem is in each region.
 As a defender of network neutrality, this is the kind of information you want to share. You can easily print, post, and pin these resources and we encourage you to do so as often as possible. If you live in California or the east coast from Virginia to Maine, please share these resources with your neighbors. If you live in other areas of the country, the full U.S.A. map and data are also pretty striking.
United States Fact Sheet: Download Net Neutrality Repeal By The Numbers, U.S.A. Edition, fact sheet here.
California Fact Sheet: Download Net Neutrality Repeal By The Numbers, California Edition, fact sheet here.
East Coast (Maine to Virginia) Fact Sheet: Download Net Neutrality Repeal By The Numbers, East Coast Edition, fact sheet here.
Check out our data, detailed maps, and analysis here. We explain our methodology and provide an overview of the maps, as well as examples of network neutrality violations from the top cable and telephone monopolies.
Links to large versions of maps:
Download the full U.S.A. map [18 MB png].
Download the full East Coast map [12 MB png]
Download the full California map [9 MB png]
This article was originally published on ILSR’s MuniNetworks.org. Read the original here.
