
Q. Whatever happened to welfare reform? In 1996, after an extensive and heated debate, Congress voted to dramatically change our welfare system. Since then the number of people on welfare has plunged. Does that mean the reforms are working?
Answer:
Let me start by saying I appreciate the way you phrase the question: does the dramatic reduction in the welfare rolls mean that welfare reform is working? Most people assume that the decline itself is sufficient proof that the changes have proven successful.
To properly answer you I need to back up for a moment (for those who want a much more detailed, heavily footnoted discussion go to Welfare in our Issues section). In talking about the welfare system we need to begin to defining the word “welfare” itself. When it comes to public policy, the word takes on a different meaning in different countries. In the United States, “welfare” refers only to programs for the poor (i.e. means-tested programs). In Europe it refers to all public assistance programs, the vast majority of which are universally available. In the United States the word “welfare” carries significant negative connotations. In Europe, at least until recently, it has not.
In the United States, means-tested welfare programs include food stamps, Medicaid, Aid to Families with Dependent Children, Supplemental Security Income (SSI), Section 8 housing, etc. The Earned Income Tax Credit (EITC), whose name presumably is meant to distinguish it from “unearned” welfare (EITC is available only to those in the work force), is itself a means-tested program.
Programs like Social Security and Medicare are rarely called “welfare”, even though they are, in part, publicly subsidized and means tested.[1] We never use the term “welfare” to describe programs that I call “reverse means-tested”. The tax deduction for interest paid on mortgages falls within this category. Indeed, any tax deduction does because those who pay no taxes receive no benefit. Those in a high tax bracket receive a higher subsidy than those in lower tax brackets.
To many Americans the word “welfare” even more narrowly tends to refer to direct cash assistance to the poor, a program known until 1996 as Aid to Families With Dependent Children (AFDC). Interestingly, the AFDC rolls stayed relatively stable at around 11 million individuals, over 70 percent of whom were children, from 1972 to 1989. At that point the numbers increased dramatically to over 14 million, a result of the economic recession of 1989-1991. There was increasing dissatisfaction of the AFDC program by both recipients and providers.

Source: U.S. Department of Health and Human Services, Indicators of Welfare Dependence: Annual Report to Congress 2004
In the 1980s, states began seeking waivers from federal welfare rules with greater frequency, in response to welfare reform provisions passed by Congress.[2] The waivers were intended to allow states to redesign their programs to more effectively enable recipients to move into the workforce. By 1996, the federal government had granted waivers to some 37 states that were home to 75 percent of the welfare population.
In 1996, the Personal Responsibility and Work Opportunity Reconciliation Act (PRWORA) was enacted by wide margins in both Houses of Congress and was signed enthusiastically by President Clinton. It is, however, somewhat misleading to call the law bipartisan given sharp difference in Congressional voting between Republicans and Democrats.

PRWORA focused just on one of our means-tested programs – AFDC. It made no or very modest changes in other means-tested programs, like food stamps, Medicaid, SSI, low-income housing and EITC programs.
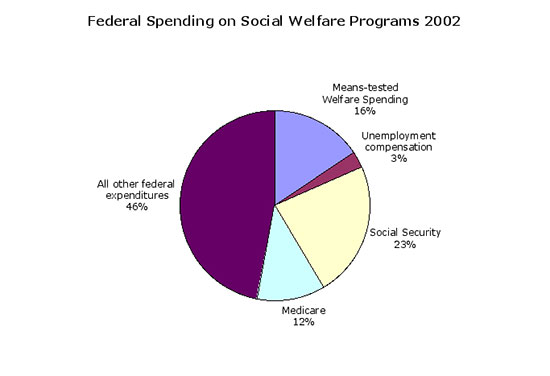
By 1996, cash assistance to low-income families, which constituted the vast majority of means-tested welfare in 1970, had become a minor and rapidly shrinking proportion. Today it comprises 6 percent of all federal means-tested spending, about 1 percent of all federal spending. Medicaid, on the other hand, represents some 46 percent of all means-tested spending.
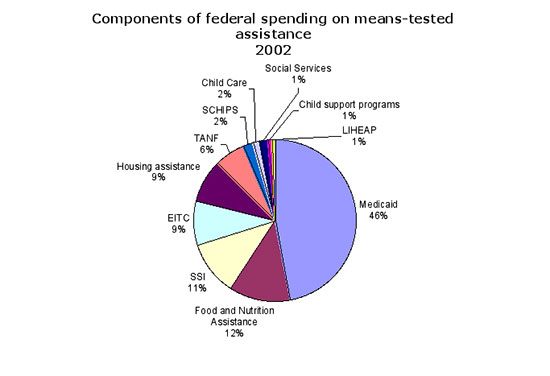
Source: Office of Management and Budget

Source: U.S. Department of Health and Human Services, Indicators of Welfare Dependence: Annual Report to Congress 2004
Virtually all of the growth in means-tested spending from 1980 to 2000 has occurred in Medicaid and the EITC.
The 1996 reform fundamentally changed the welfare rules. Aid to Families with Dependent Children (AFDC) was an entitlement program where families who met the eligibility requirements were guaranteed cash assistance. It was replaced by Temporary Assistance to Needy Families (TANF), a program in which cash assistance is not guaranteed. Under AFDC, federal matching funds automatically increased if states spent more on welfare. Under TANF the federal payment takes the form of a block grant, which is capped. If caseloads increase or if benefit levels rise, the federal payment does not increase. If, on the other hand, caseloads decrease or benefit levels fall, the federal payment does not decrease.
In 1996, Congress appropriated $16.5 billion to fund TANF. The program has been extended twice, without increasing the funding level (although there was a substantial infusion of money for child care after 1996). The latest extension expires September 30, 2004.
Under TANF, an individual can receive no more than 60 months of cash assistance during his or her lifetime. Each state must move a minimum proportion of its welfare recipients into the labor force: 50 percent of single parent families; 90 percent of two parent families.
Welfare rolls have plummeted by 59 percent from 1994 to 2002, from 5.1 million to 2 million families. Many studies have examined the relationship between the 1996 reform and this unprecedented decline in caseloads. Their conclusions vary, but the following observations may be justified.
1. A significant portion of the caseload declines, from one-third to two-thirds, was a result of the booming economy in the last half of the 1990s. During that period unemployment dropped to its lowest level in 40 years. Poverty levels declined substantially.
2. The combination of economic expansion, welfare reform and higher EITC payments spurred an unprecedented increase in the percentage of single women in the work force. One important component was the availability of child care funds for working moms.
3. Changes in the welfare rules that tightened eligibility requirements and imposed greater sanctions on recipients accounted for a significant proportion of the caseload decline.
Caseloads dropped substantially in Georgia, for example, where before someone can begin the application process, she must get a form signed by six employers saying that she applied in good faith for a minimum wage job and was turned down. Once enrolled, if she is penalized twice for failure to meet some administrative/work requirements, she is barred for life from seeking aid to the state.
In the early 1990s about 75 percent of those who walked into the welfare office to apply wound up on welfare rolls. Today it is closer to 25 percent. TANF applicants who are “diverted” have lower education levels and are more likely to be disabled or have severe health problems. A growing number of states (13 at last count) now drop entire families from the welfare rolls after the first instance of non-compliance by the adult recipient.
4. A reduction in caseloads does not necessarily translate into an improvement in the lives of those formerly on the rolls. The proportion of families leaving welfare who are not employed was 50 percent in 1999 and 58 percent in 2002. Some 55 percent of families who exit welfare remain in poverty the first year after leaving; 42 percent remain poor after five years.
5. A growing number of poor families and children do not receive cash assistance. In the mid-1990s about 85 percent of children living in poverty received such assistance. In 2002, only 33 percent did.

Source: U.S. Department of Health and Human Services, Indicators of Welfare Dependence: Annual Report to Congress 2004
6. Caseloads continued to drop even after the economy fell into a severe recession in 2001 and 2002 while other means-tested programs expanded. For example, while welfare caseloads dropped by 4 percent, the number of people on food stamps increased by 38 percent. Thus the traditional means-tested program connection between rising need and rising welfare expenditures and recipient numbers has been broken.

Source: U.S. Department of Health and Human Services, Indicators of Welfare Dependence: Annual Report to Congress 2004
Notes
[1] The general fund contributes to Medicare. Workers with lower lifetime earnings receive a higher percentage of their wages in social security payments than high wage earners.
[2] Section 1115 of the Social Security Act of 1962 authorized the Secretary of DHHS to waive AFDC requirements in order to enable states to carry out experimental projects deemed likely to help promote the goals of the program. Prior to the 1980s the Department of Health and Human Services had granted waivers infrequently, mainly for experiments involving administration and service delivery.
![]()
![]()
![]()
![]()