Burning garbage to generate power is neither clean nor renewable. Yet, aging, costly, and polluting solid waste incinerators have been bolstered by a dirty secret — 23 states legally classify incineration as “renewable” in their energy goals and commitments.
Key Links:
Executive Summary
Burning garbage to generate power is neither clean nor renewable. Yet, aging, costly, and polluting solid waste incinerators have been bolstered by a dirty secret — 23 states legally classify incineration as “renewable” in their energy goals and commitments.
In a moment of fundamental transformation in the energy sector, three realities of waste incineration demonstrate the need for stronger definitions of renewable energy and lend support to grassroots efforts fighting to close the 76 waste incinerators that continue to operate across the country today:
1 | The economics of waste incineration plants don’t add up.
Incinerators have proven risky investments for cities and utilities, particularly as energy prices decline and a growing number of plants are unable to cover operating costs or remain competitive. Tip fees (i.e., the waste disposal fees paid by haulers and ultimately passed down to cities and customers) at incinerators are often two to three times higher than comparable recycling or composting costs. Incinerators also lose in a jobs comparison; composting sites, for example, can create four times the number of local jobs per unit of waste processed than incinerators.
2| Incinerators provide a classic case of environmental injustice.
Pollution produced by burning garbage subjects communities near waste incinerators — disproportionately made up of low-income, people of color — to harmful, costly, and avoidable public health risks.
3| “Renewable” trash burning is a legal oxymoron.
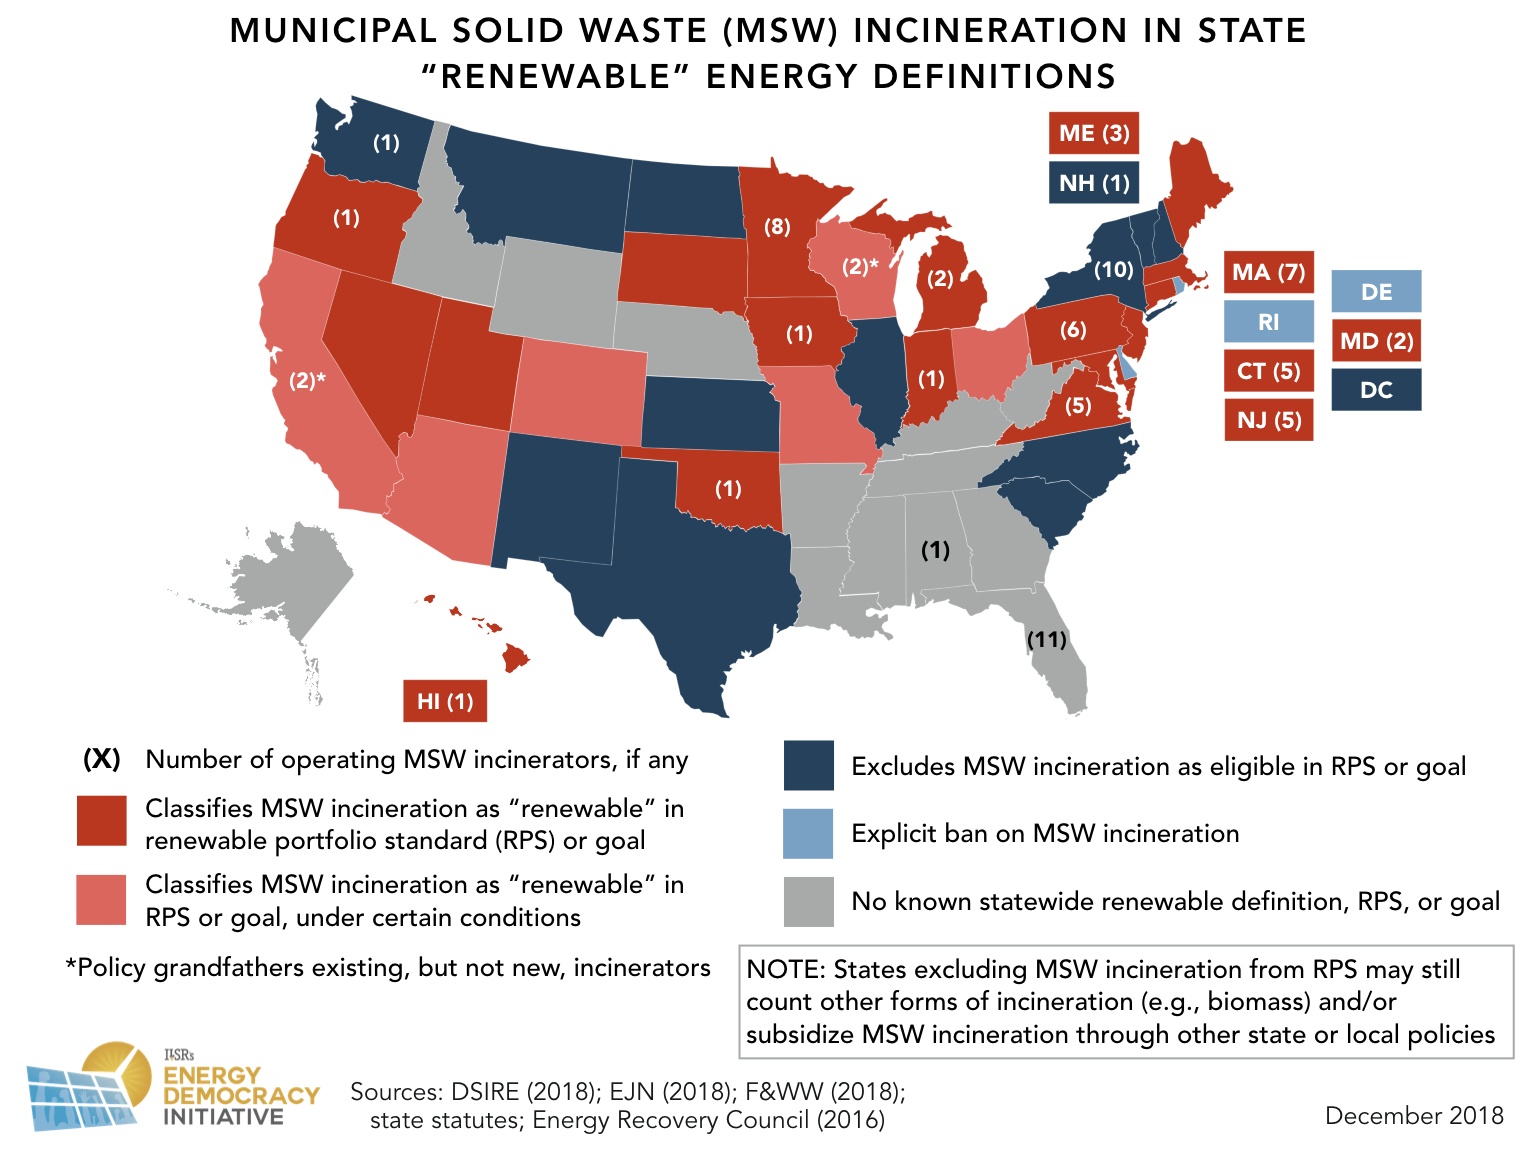
A majority of incinerators (52 out of 76 operating plants or 68 percent) are located in states that classify municipal solid waste incineration as a renewable source of energy, as illustrated below.
The overlap between where incinerators are located and which states classify the practice as “renewable” is no coincidence. Such definitions, promoted by the incineration industry, make burning trash eligible for subsidies that put the practice in direct competition with renewable energy projects including wind and solar.
The report concludes by outlining ways to combat this dirty industry, calling on state legislators to strengthen laws that ensure resources and clean energy commitments billed as renewable are in fact so. It provides recommendations for how communities can instead invest in healthier, more economic, and ultimately more sustainable waste management and energy systems.
An Incineration Primer
Waste incinerators are dirty and expensive. Despite this reality, many states classify the energy produced by burning garbage as a renewable resource. Today, as many as 23 states allow municipal solid waste incineration to be counted toward their renewable requirements or goals. Other state and local policies also define “renewable” energy in ways that make trash burning eligible for additional incentives, including tax breaks or economic development programs.
The perverse designation of incineration as “renewable” subsidizes a practice that wastes energy, kills jobs, and produces toxic pollution. Including incineration in legal definitions of renewable energy hampers investments in cleaner, more equitable sources of local energy and waste management alternatives. Instead, investments in distributed and renewable resources like solar provide electric customers––individually and collectively––with greater choice over the source and structure of their energy system. Investing in recycling and composting programs to manage our waste builds wealth locally, creates jobs, enhances soils, and helps support more resilient and healthy communities.
Today, 76 aging municipal solid waste incinerators across the U.S. burn trash to generate steam or electricity.
Most trash incinerators in the U.S. were built as metropolitan areas expanded and waste generated per capita rose between the 1970s and 1990s. Low-cost, nearby landfills filled up, while interstate battles were waged over where solid waste could be sent.[1] More sustainable and robust citywide waste management options, such as recycling or composting, were still in their infancy.
The incineration industry capitalized on the 1970s Energy Crisis by promoting energy production as a byproduct. The industry was bolstered by the passage of the federal Public Utility Regulatory Policies Act (PURPA) of 1978. This policy allowed incinerators to sell electricity to public utilities through power purchase contracts, providing an additional source of revenue.
Learn more about the complex history and potential future of the Public Utility Regulatory Policies Act of 1978, by reading ILSR’s article: “PURPA: A Quiet Death or Longer Life After 40 Years of Wholesale Electricity Competition?” [2]
According to experts, most municipal solid waste incinerators were designed to operate for a maximum of thirty or forty years. Since few new plants have been built since the 1980s — the last incinerator built on a new site in Dickerson, Md. came online in 1995 — expansions adjacent to old facilities and retrofits of existing plants have become more common. For example, a $672 million facility that opened in 2015 in West Palm Beach, Fla., was constructed immediately adjacent to another aging yet still operating unit, with the capability to produce up to 95 megawatts of electricity (enough for about 20,000 homes). Such projects are undertaken to comply with air quality standards, extend the lifespan of their units, or increase their electricity generation capacity.
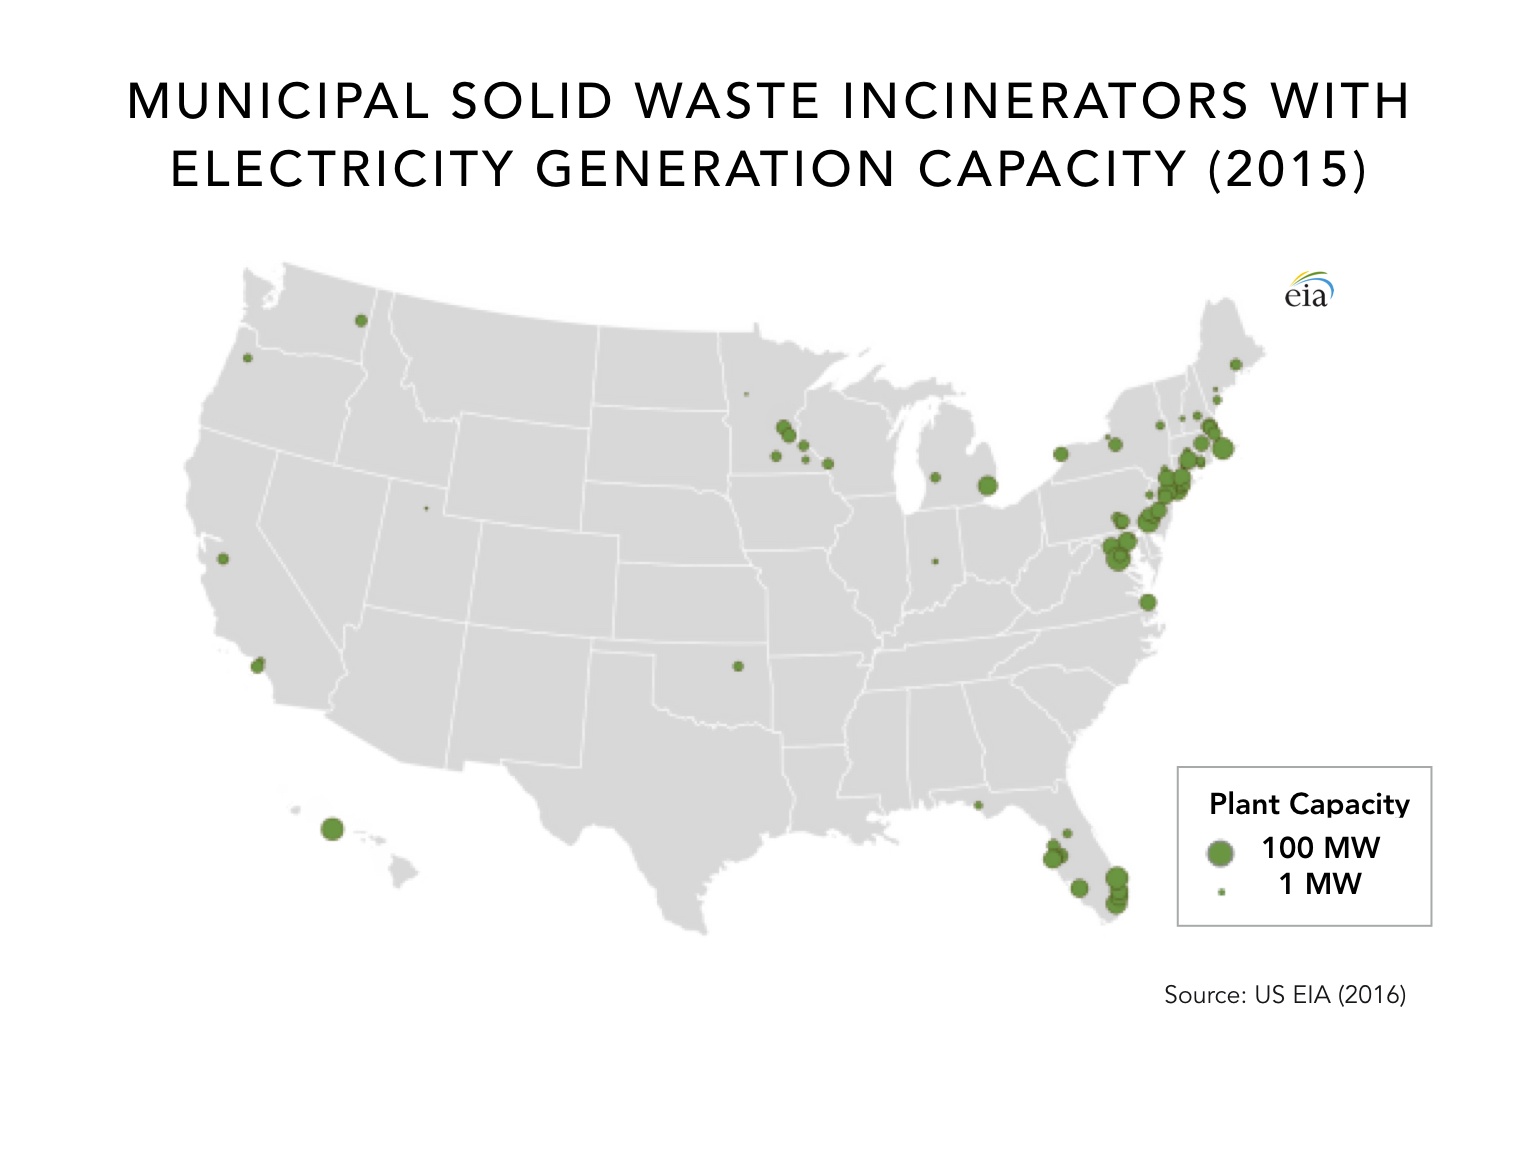
Although several incinerators have closed in recent years and more closures are anticipated,[3] the following map of incinerators from the U.S. Energy Information Administration (EIA) illustrates where incineration facilities with capacity of at least 1 megawatt historically operated and clustered.[4] Most are found in or near large metropolitan areas in the northeast, Mid-Atlantic, Upper Midwest, and Florida, with a handful of smaller facilities elsewhere. At the time that these data were published, EIA estimates municipal solid waste incinerators could generate about 2.3 gigawatts of electricity at full capacity, equivalent to less than one percent of U.S. power generation nationally, but enough to power just under a half a million homes.
If you’re interested in exploring whether or not there is a trash incinerator near your community, check out Energy Justice Network’s interactive, open source Energy Justice Map of existing, proposed, closed, and defeated dirty energy and waste facilities across the United States.[5]
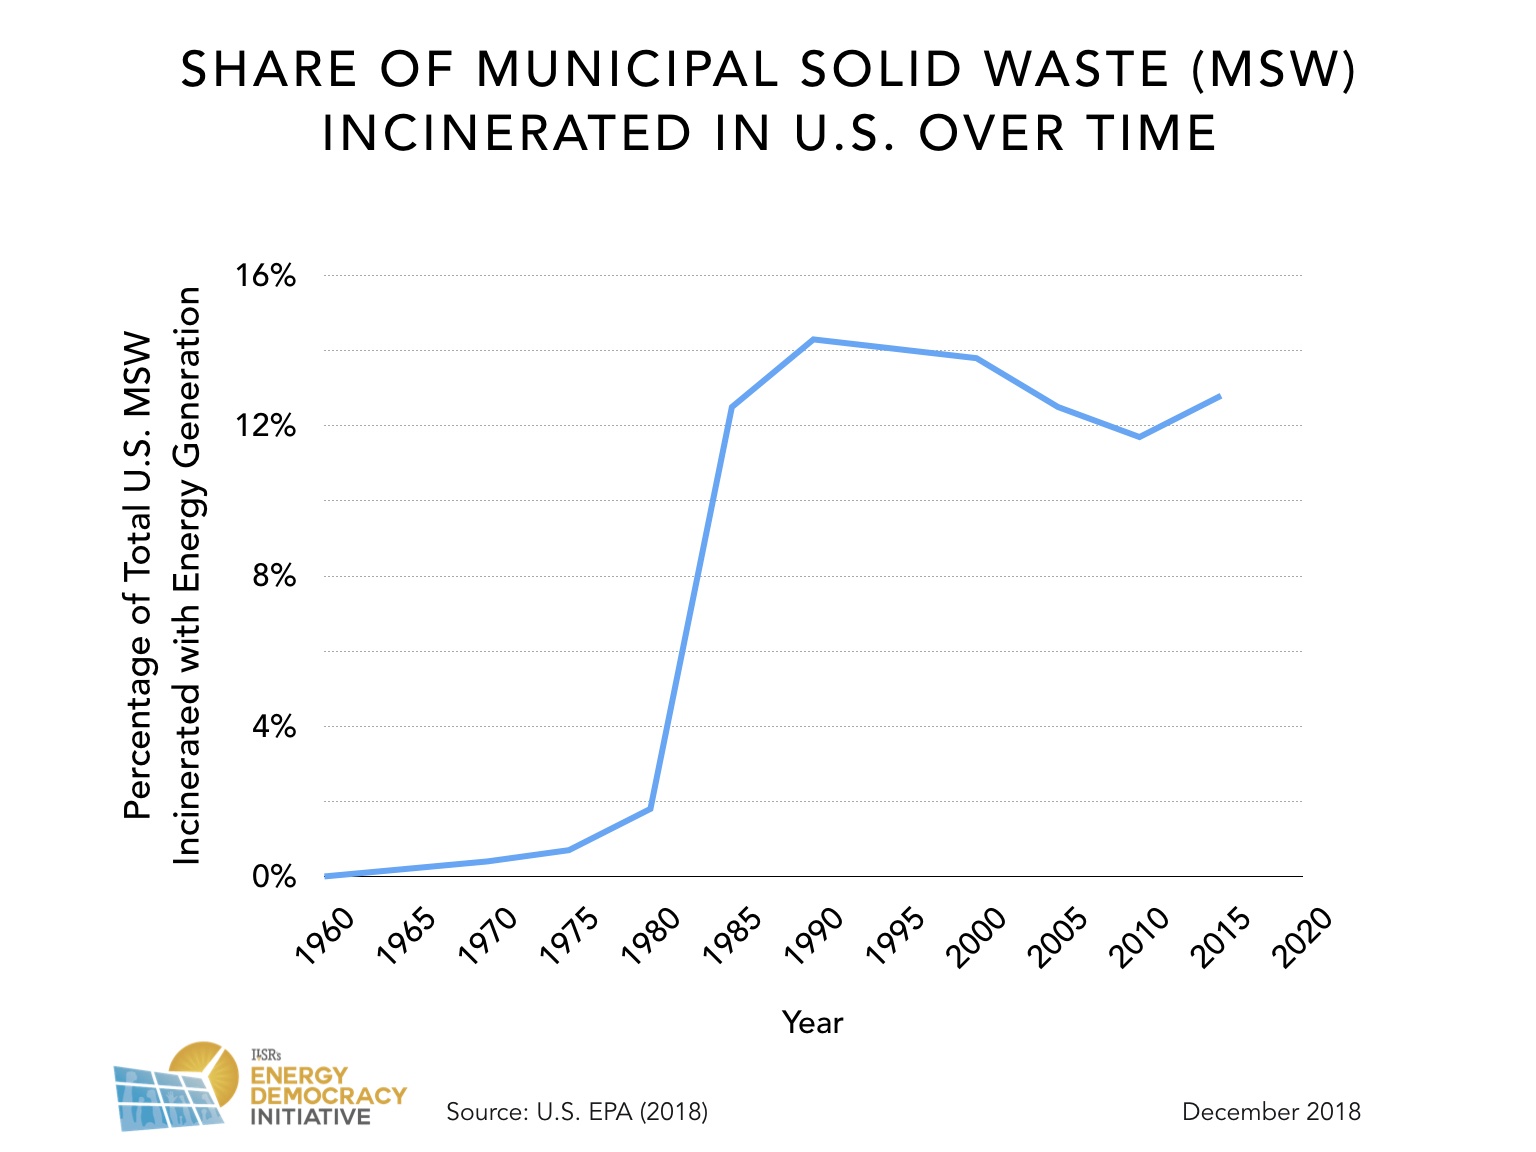
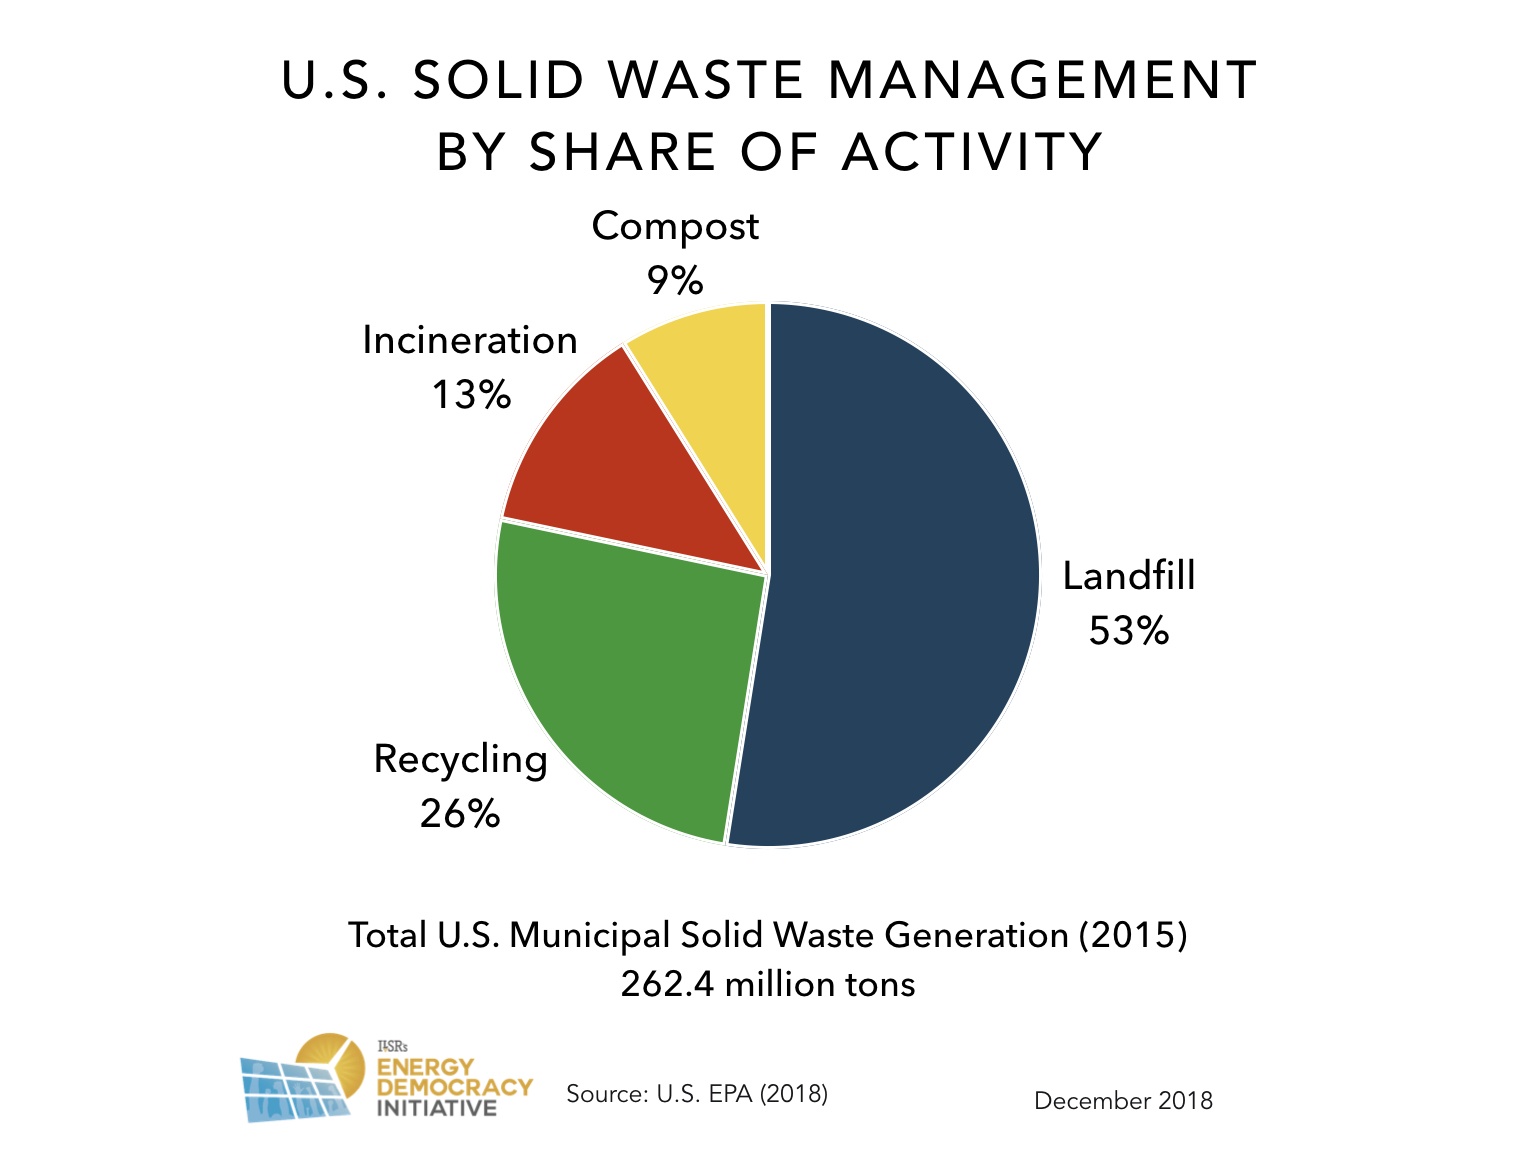
On average, Americans have thrown away more garbage over time, and total solid waste generated per capita in the U.S. has grown accordingly. However, both the amount and share of residential and commercial waste heading to incinerators has generally levelled off since its peak in the 1990s, as illustrated below.[6] Since 2010, an average of about 30 million tons of municipal solid waste is sent to incinerators with energy generation each year, compared to about 136 million tons landfilled, 67 million tons recycled, and 22 million tons composted.
Incineration pales in comparison to other solid waste management strategies. In 2015, roughly half of all municipal solid waste in the U.S. was landfilled; while recycling and composting made up more than 25 and 8 percent, respectively.
Electricity from waste incinerators also represents a small fraction of electricity generation. As noted earlier, estimated energy generation capacity of operating incinerators was about 2.3 gigawatts in 2015. For comparison, more than 10.5 gigawatts of new solar and nearly 8.5 gigawatts of new wind went online in that year alone.[7]
Decades-old incinerators are quickly becoming obsolete, as both cleaner waste management strategies, including recycling and composting, and cleaner energy from wind, solar, and storage technologies, expand. Still, unlike coal plants, which are shuttering at a rapid pace, aging incinerators have managed to hang on and continue operating.
One state representative found this disconnect rather absurd. “Incineration is a 1980s solution to a 21st century problem,” writes state representative Frank Hornstein (D-Minn.), in an editorial responding to a proposed expansion of the nearby Hennepin County Energy Recovery Center, in 2013.[8]
“Incineration is a 1980s solution to a 21st century problem,” writes state representative Frank Hornstein (D-Minn.), in an editorial responding to a proposed expansion of the nearby Hennepin County Energy Recovery Center, in 2013.
“Waste-to-Energy” or Wasted Energy
The relatively small amount of energy generated with incineration enabled the incinerator industry to brand themselves as “waste-to-energy” facilities.[9] Neil Seldman, co-founder of ILSR and director of ILSR’s Waste to Wealth initiative, cautions that this term is very misleading.
“We refer to incineration as ‘wasted energy’ or ‘waste-of-energy’ because this process really burns up more energy than it produces.” —Neil Seldman, co-founder of ILSR and director of ILSR’s Waste to Wealth initiative
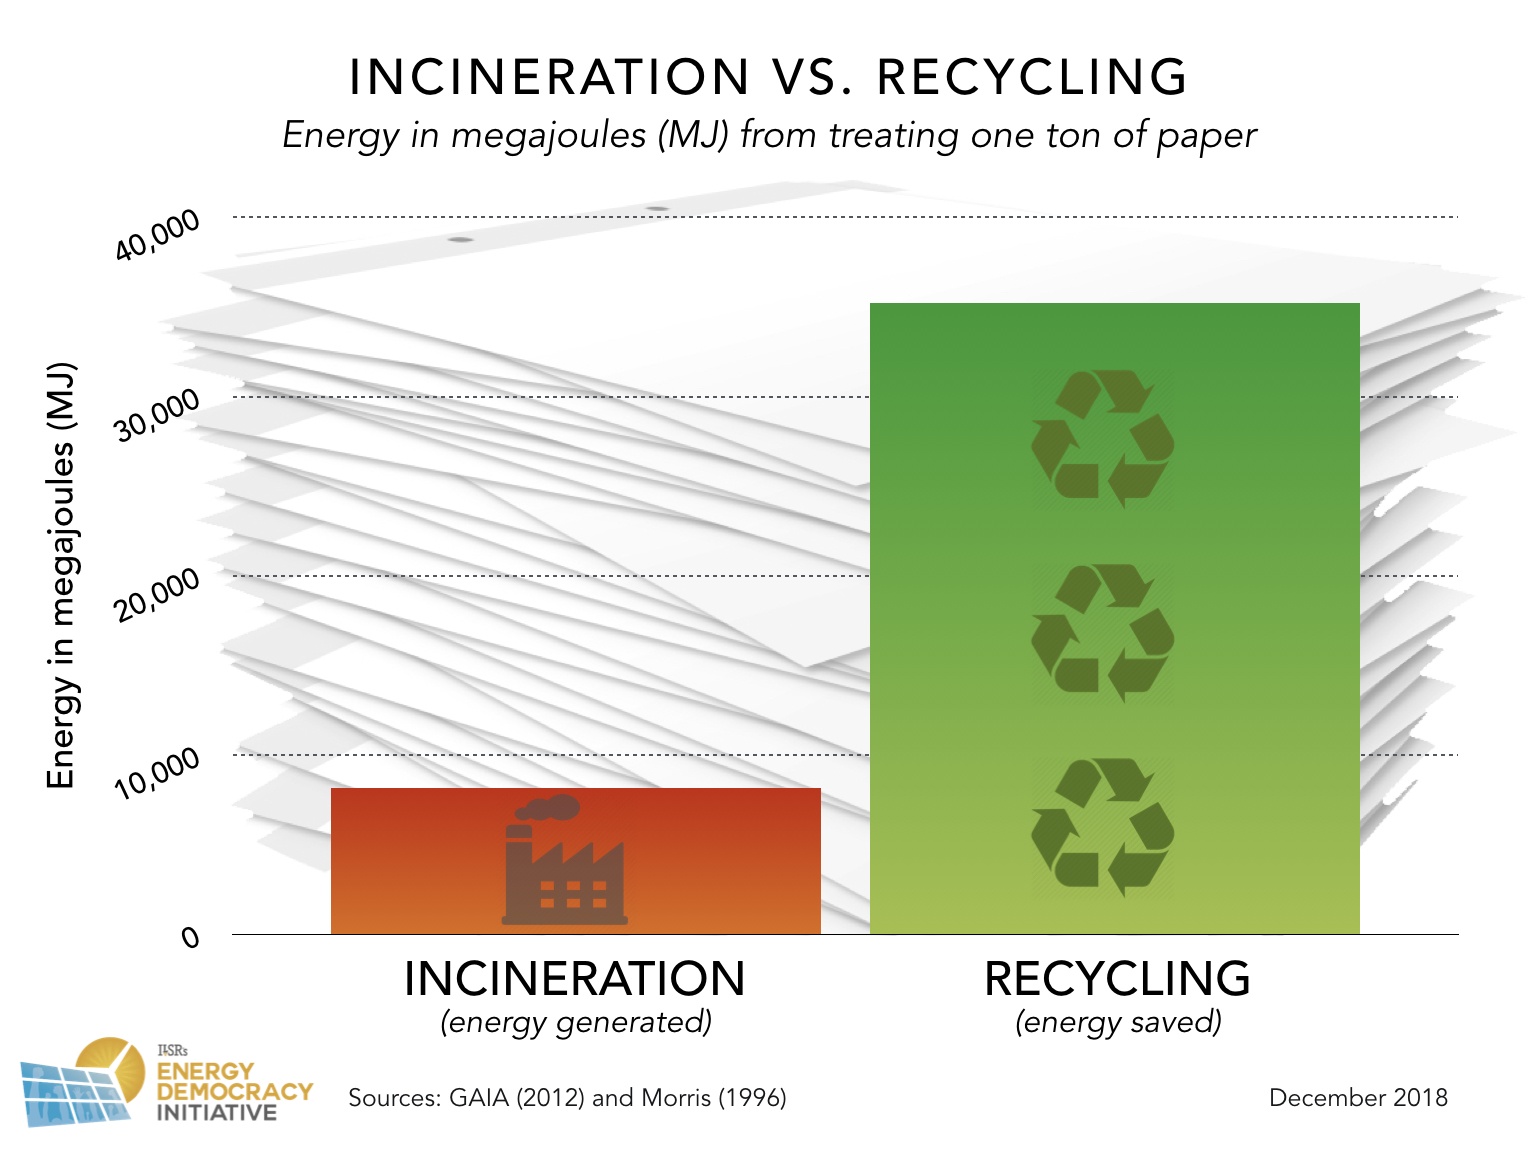
When accounting for the embodied, life-cycle energy — that is, the amount of energy used to source, manufacture, and transport materials for consumption — of solid waste burned at incinerators, there is a net energy loss.
According to a fact sheet[10] from the Global Alliance for Incinerator Alternatives that draws on an earlier, peer-reviewed life cycle assessment[11] of waste management options, three to five times more energy can be “saved through alternative strategies such as waste prevention, reuse, recycling, and composting than can be generated by burning.” For example, an incinerator can burn a ton of paper and generate about 8,200 megajoules of energy. However, recycling that same ton of paper saves about 35,200 megajoules of energy by effectively saving the upstream “embodied energy” needed to manufacture and supply new, virgin paper, including the fuel and energy costs associated with harvesting timber, powering paper mills, and transporting paper to market.
In general, recycling or composting the items typically found in municipal solid waste streams offers energy savings. But by creating a market for the electricity produced by burning solid waste, incinerators discourage efforts to conserve resources, reduce packaging and waste, or recycle and compost.
More than 90 percent of materials disposed using incinerators and landfills could instead be cost-effectively reused, recycled and composted, according to ILSR’s Stop Trashing the Climate report.[12]
Incineration has managed to bill itself as a solution to cities’ waste and energy needs, while failing to do so cost-effectively or sustainably. Instead of turning waste into energy, incinerators are wasting energy — and money.
Economics of Incinerators Don’t Add Up
Capital costs for new waste incinerators, as well as their operation, maintenance, and meeting regulatory compliance of these facilities, are no small investment for local governments. In Hennepin County, Minnesota, for example, the county had to borrow a significant portion of the $160 million necessary to construct the Hennepin Energy Recovery Center (HERC) in the late 1980s. HERC has not always met its operating costs or debt obligations, relying on county subsidies to continue operating. In 2010, HERC required a $1.8 million operating subsidy from the county, or $4.95 per ton of waste.[13]
Some knew better than to expect an economic windfall from incineration. Lawmakers in Rhode Island passed a law in the early 1990s, for example, banning municipal solid waste incineration in the state.[14] They justified the decision based on the simple economics.
“Incineration of solid waste is the most costly method of waste disposal with known and unknown escalating costs, which would place substantial and unreasonable burdens on both state and municipal budgets to the point of jeopardizing the public’s interest,” reads Rhode Island’s law (State Senate Act 92-S 2502).[15]
What Rhode Island had the foresight to realize, other communities have had to learn the hard way. In 2011, for example, hundreds of millions of dollars in debt and debt guarantees that Harrisburg, Pa., took on to fund an incinerator retrofit project ultimately drove the city into bankruptcy and left a stranded asset.[16] Energy Justice Network founder Mike Ewall predicted this and warned the city eight years prior.[17]
“A new incinerator was supposed to earn … $1 billion. Instead, it’s a cautionary tale for what happens when an infrastructure project goes bad,” explained coverage of Harrisburg’s bankruptcy in Governing Magazine.[18] The Harrisburg incinerator isn’t alone in struggling to make ends meet.
One of California’s three remaining incinerators closed earlier this year after failing to remain profitable,[19] upon losing its long-term power purchase agreement with one of the state’s incumbent utilities. Minnesota’s Elk River incinerator “can no longer sell electricity at a price that will cover its costs,” according to the plant manager.[20]
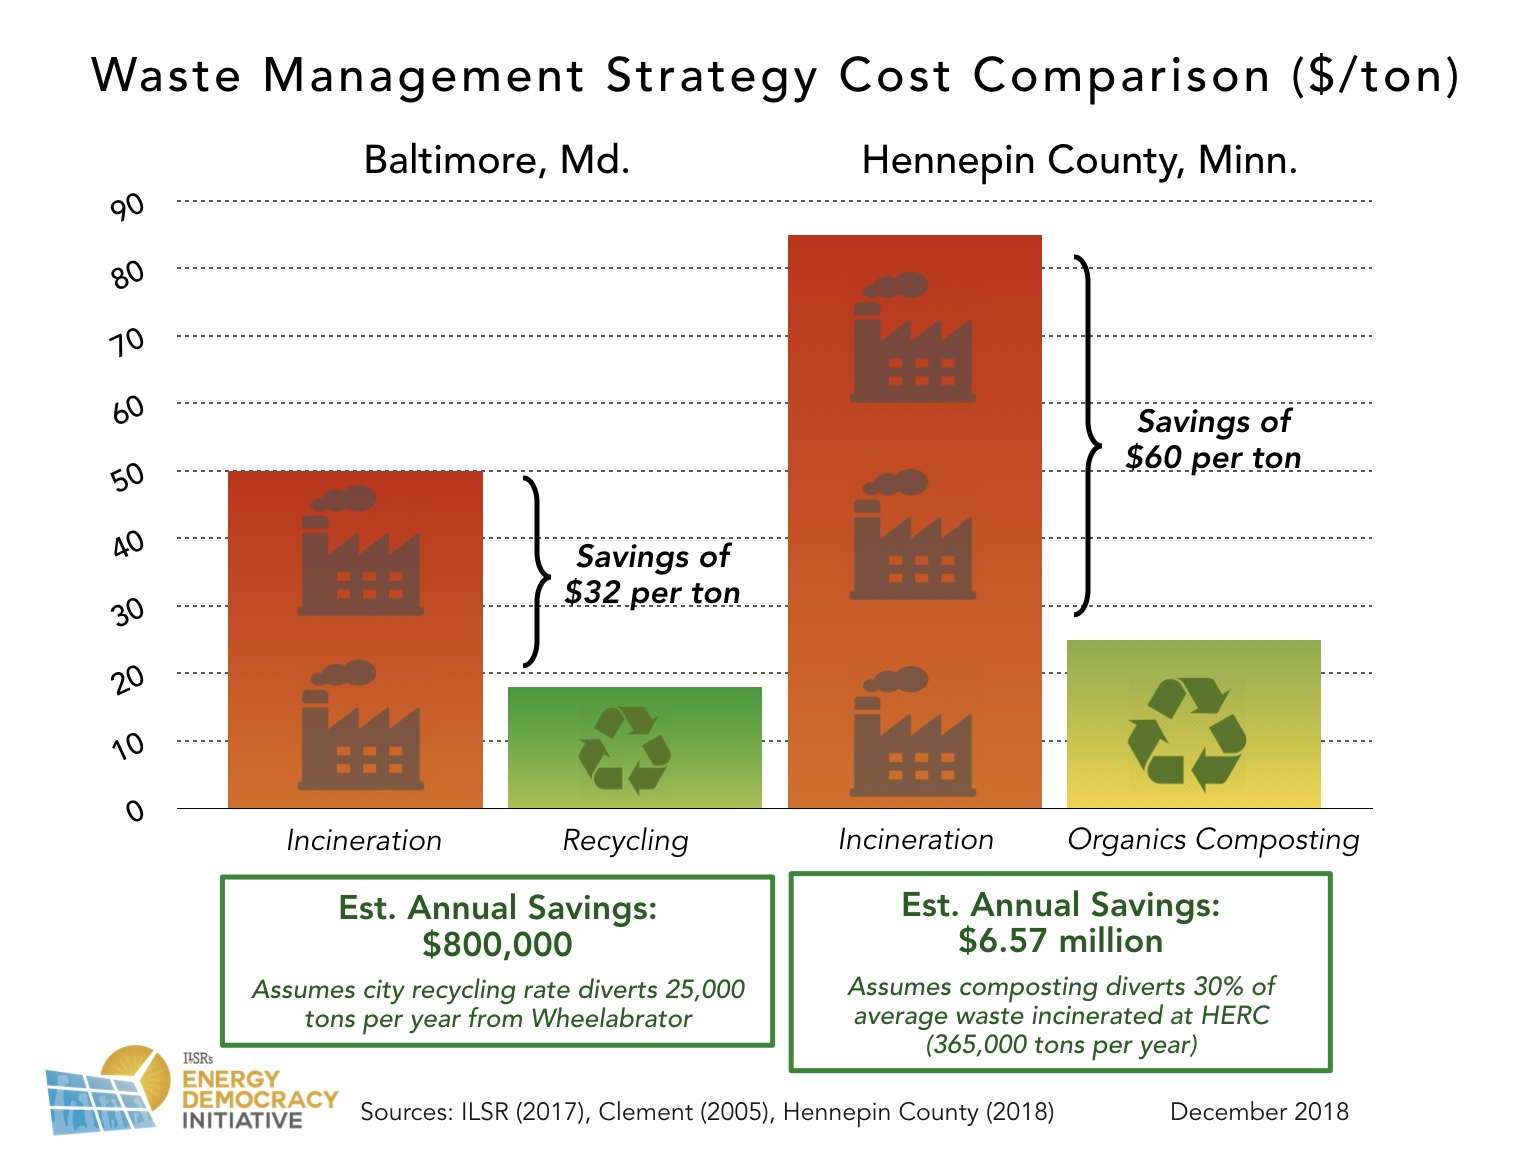
Not only do incinerators cost a lot to build and operate, but they are also rarely cost-competitive compared to other forms of local waste management. In Baltimore, recycling costs the city an estimated $18 per ton, whereas trash incineration at the Wheelabrator Baltimore costs nearly three times that amount, an estimated $50 per ton. As a result, for each ton of waste it recycles instead of incinerates, Baltimore saves $32 per ton or the equivalent of $800,000 each year, based on the city’s current recycling rates.[21]
Incineration costs at the HERC in Minnesota have fluctuated but never fallen low enough to compete with alternatives.[22] The county charges only $25 per ton for source-separated organics, a savings of $60 and less than half what the incinerator charges.[23] If 30 percent of the HERC’s annual 365,000 tons of incinerated waste (roughly equivalent to the organic content burned by the facility today) were instead composted or otherwise diverted, waste haulers in Hennepin County would save an estimated $6.57 million in tip fees each year and could ultimately reduce costs born by the cities and customers they serve.
An illustration of these waste management strategies, costs, and savings from recycling and composting in both Baltimore and Hennepin County, is below. Unfortunately, by spending public dollars on tip fees at incinerators, local governments may not have many resources left to invest in more cost-effective recycling or composting sites and programs.
Incinerators also lose out in a job creation comparison. An analysis comparing the employment impacts of different waste management strategies by ILSR Composting for Community Initiative illustrates how compost sites can create four times the number of jobs per unit of waste as incinerators.[24] For example, in Maryland, every 10,000 tons of compostable waste sent to composting facilities creates demand for about 4.1 full-time jobs, compared with 2.1 jobs at landfills and 1.2 jobs at incinerators.
With scant evidence that the economics of incineration pay off for communities, waste incineration plants should be a “hard sell” for local governments.[25]
Environmental Injustice
Incinerators generate harmful pollution posing a risk to human health in nearby communities. Burning trash releases dioxin, lead, and mercury (in many areas, incinerators are the largest sources of these pollutants),[26] greenhouse gas emissions including both biogenic sources and carbon dioxide,[27] and hazardous ash.
Furthermore, incinerators are disproportionately located in areas that directly impact already overburdened and marginalized communities, including low-income households and people of color.[28] An analysis of the population surrounding incineration facilities compared to the national average using a “race ratio” indicator (i.e., percent of people of a given race within a given distance of an incineration facility, divided by the national average of that group), suggests that people of color are, in general, more likely than white people to live within any distance of these plants, as illustrated below.[29]
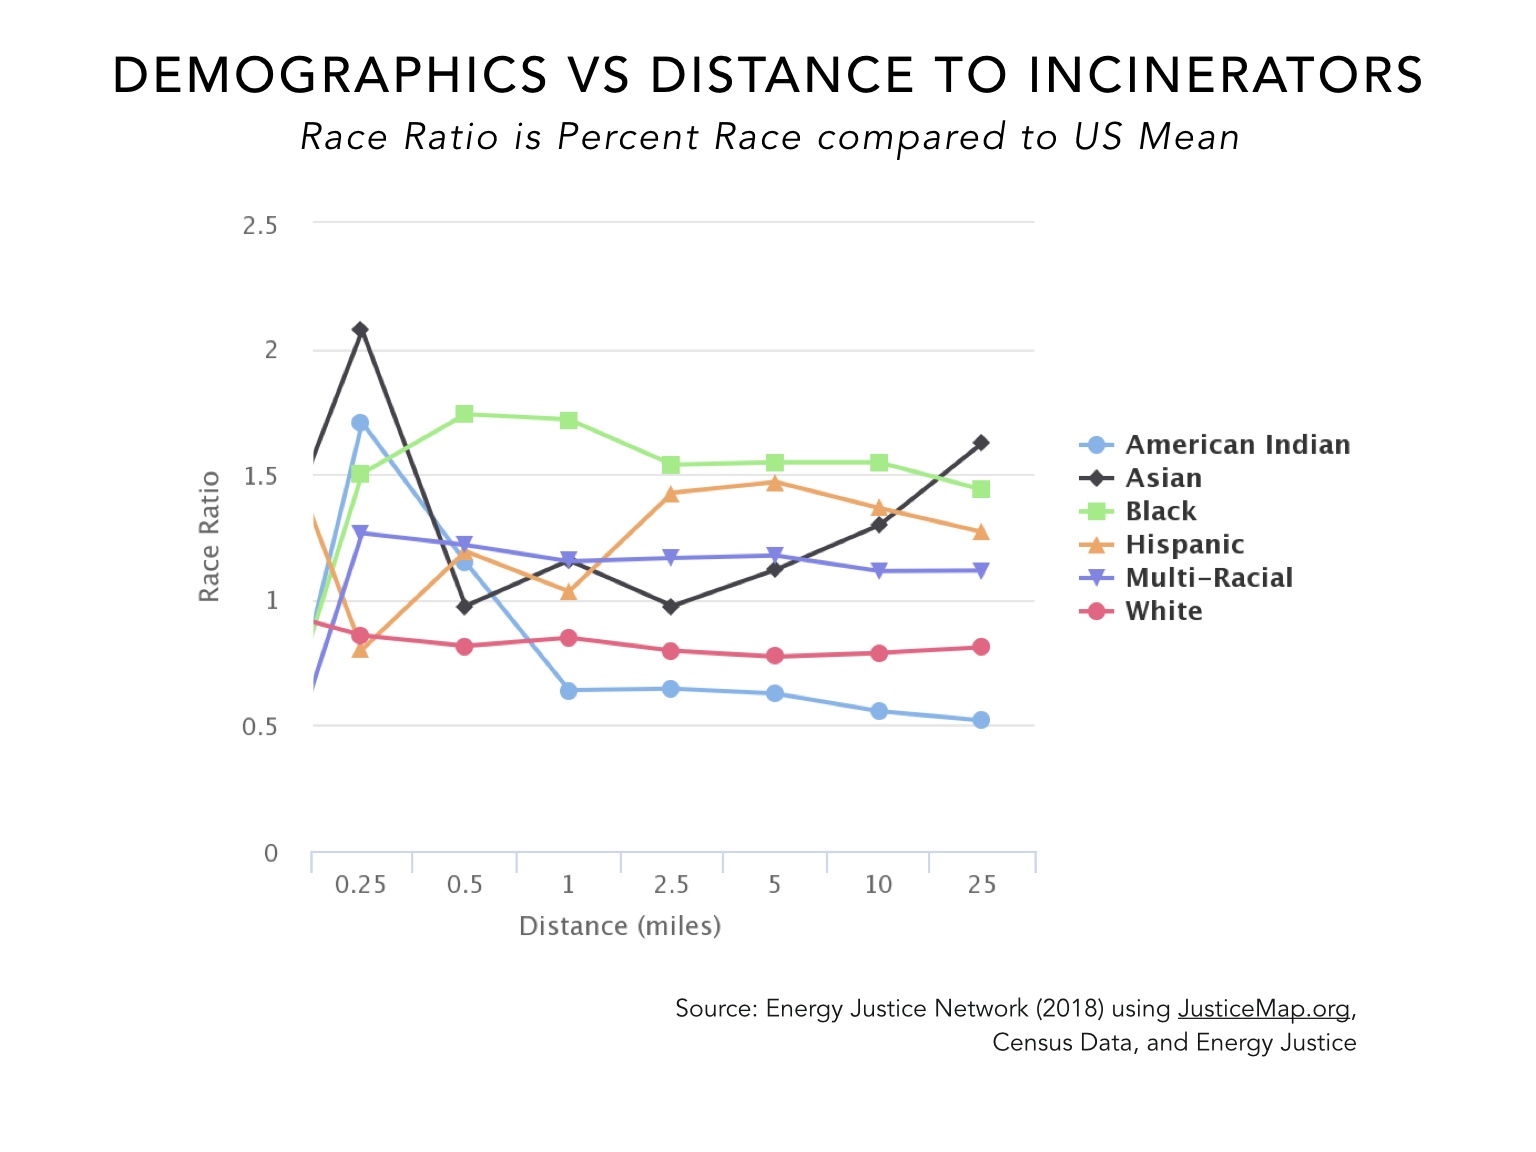
To illustrate these stark disparities on the ground, the following screen captures of the Energy Justice Network’s mapping tool visualize the location of the incinerator in Midtown Detroit. Data from the U.S. Census show that the majority of Census blocks in Detroit and near the Detroit incineration facility have a large percentage of residents identifying as Black or African American, while median household income, well below the national average.
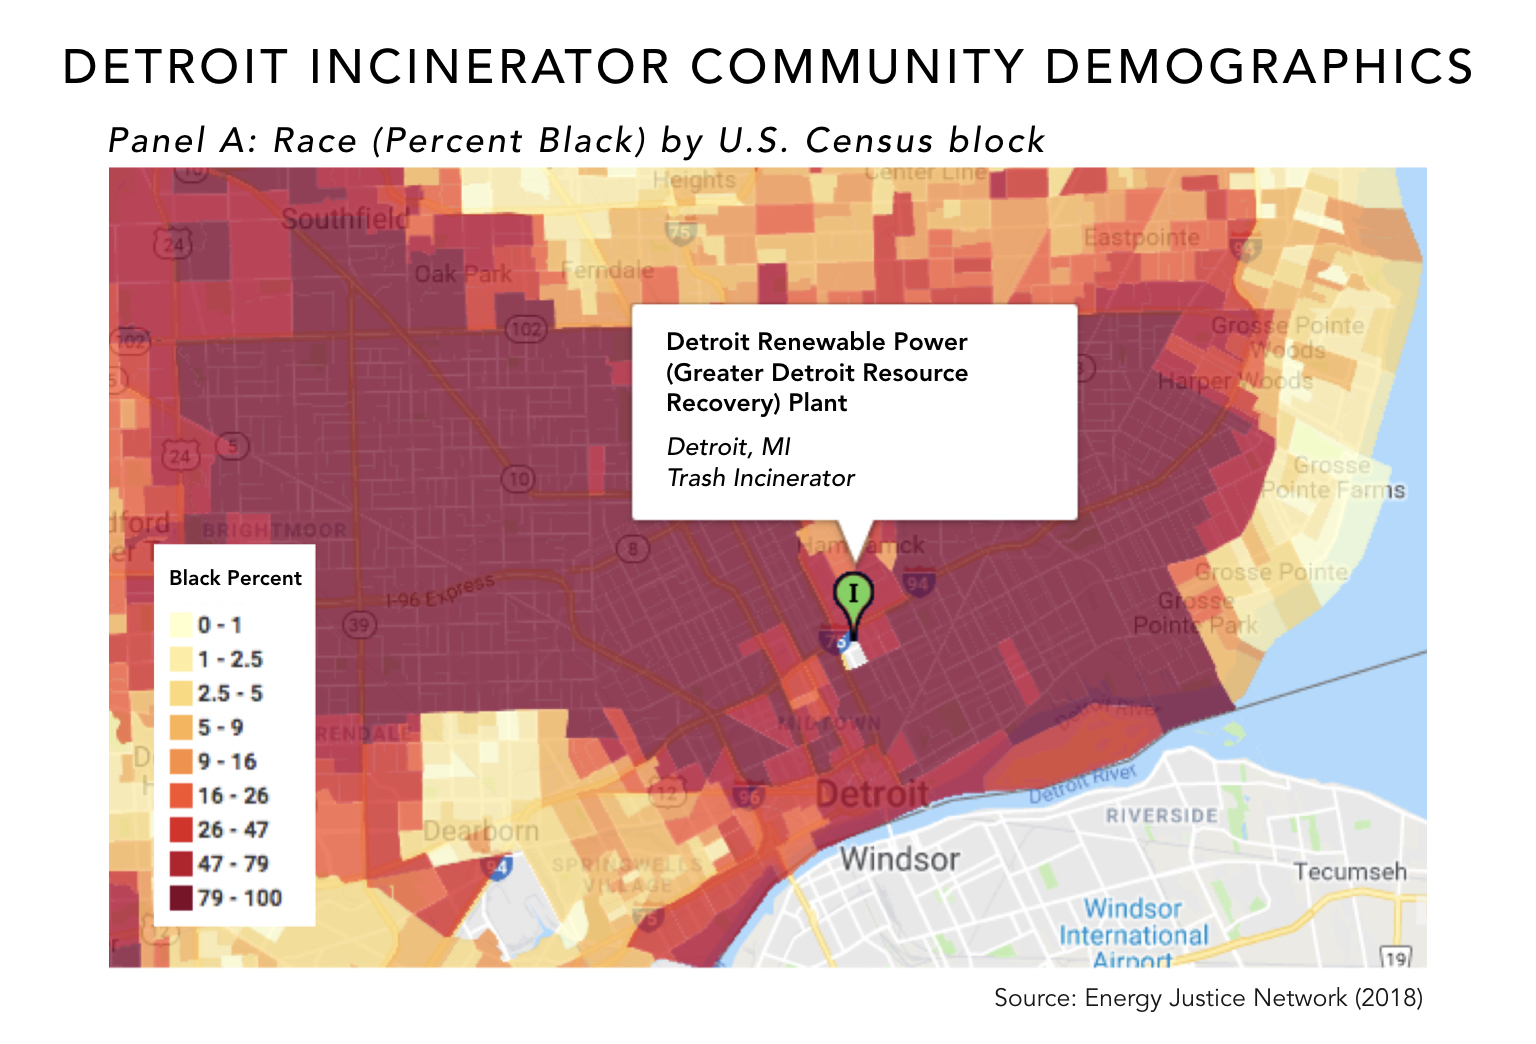
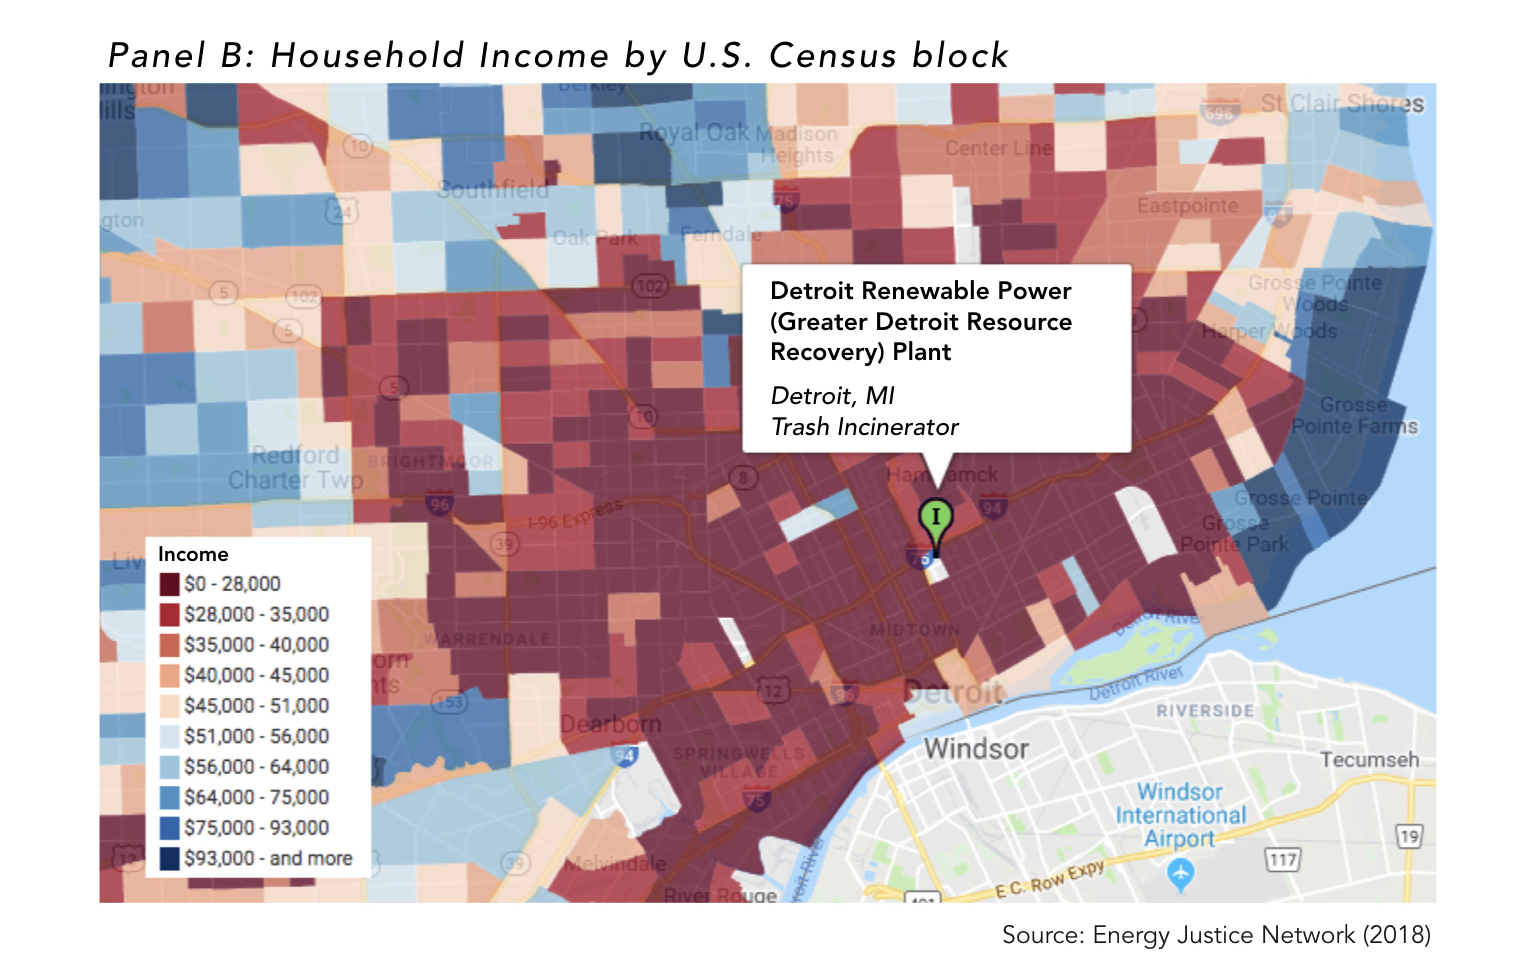
Notably, Detroit’s incinerator imports a large percentage of the waste it burns from the metropolitan area’s whiter and wealthier neighboring suburban communities into the city. Over the last five years, this facility has exceeded air quality standards more than 750 times, in what has been called “a classic environmental injustice.”[30] Neighborhoods near the incinerator continue to bear the brunt of this excessive pollution.[31]
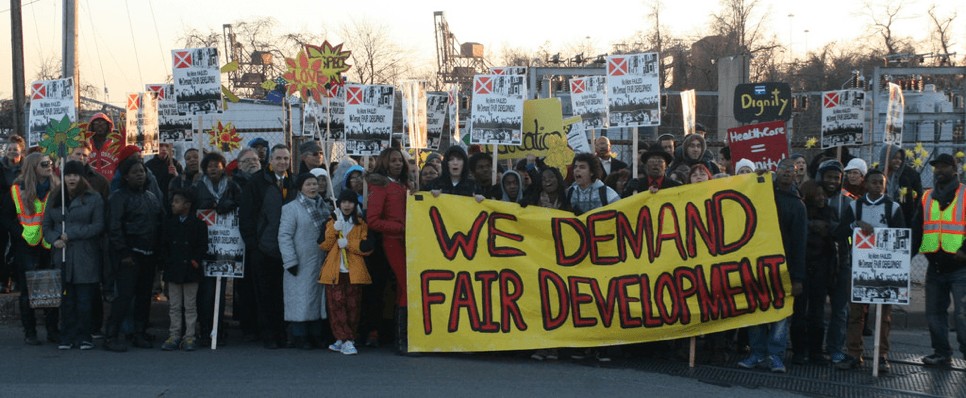
Fighting for Environmental Justice: A Grassroots Anti-Incineration MovementLiving close to incinerators exposes nearby marginalized communities to high levels of pollution. However, many of these same communities have not sat idly by — they’ve put up a fight, calling attention to the harmful impacts of incineration and proposing alternatives. The anti-garbage incineration movement in the U.S. has a rich and unique history. It was ad hoc, spontaneous, simultaneously nationwide, and led by regular people drawn from all walks of life, according to Neil Seldman, co-founder of ILSR and director of ILSR’s Waste to Wealth initiative, who has supported bottom-up community efforts to combat new and proposed incinerators for decades. In early campaigns, Seldman recalls participation from an airline stewardess and her husband a pilot, a stand up comic, home maker, doctor, nun, stockbroker, highway engineer, wastewater facility manager, grade school teacher, grade school student, and college professor, to name a few. The anti-incineration movement has and continues to bring together people across ethnic, racial, gender, age, and political identities within and across cities. Community efforts have been instrumental in slowing and stopping the growth of incinerators nationwide and raising awareness about the impacts of these facilities. For example, the industrial communities of Curtis Bay-Brooklyn in Baltimore, won a victory when organizing efforts defeated the proposed Curtis Bay Incinerator in 2016.i Organizations including but not limited to the Energy Justice Network, Global Alliance for Incinerator Alternatives, Zero Waste Detroit, ILSR, and countless others have organized and supported grassroots efforts across local, state, national, and even global contexts to combat the incineration industry. NotesiSeldman, Neil. 2016. “Activists Win The Day: Huge Grassroots Victory Over Curtis Bay Incinerator.” ILSR. Available at: https://ilsr.org/activists-win-the-day-huge-grassroots-victory-over-curtis-bay-incinerator/ Photo Credit: United Workers (March to Stop the Incinerator) via Flickr CC 2.0 |
The mercury and dioxin produced by incinerators can bioaccumulate in fish and other aquatic species, contaminating local and traditional food sources that “communities of color, low-income communities, tribes, and other indigenous peoples” more often rely upon for subsistence than wealthier, white populations.[32]
Many fossil fuel uses cause pollution, but burning garbage may even be more harmful than coal. Waste incinerator emissions vary depending on the mix and toxicity of materials present in the trash being burned and technology utilized. However, dioxins, hydrogen chloride emissions and greenhouse gas emissions, once biogenic sources are accounted for, have been reportedly higher per unit of electricity generated on average for waste incineration than coal-fired power plants.[33] In one year, incinerators in New York reportedly emitted 14 times more mercury per unit of energy generated than the state’s coal plants, while another study in Maryland found incineration facilities emitted nearly 6 times more mercury compared with coal plants in the state.[34]
Conversely, closing these aging combustion plants can have substantial, quantifiable, and immediate benefits. In one recent study, women living within five kilometers of shuttered coal plants, exposed most often and at higher rates to associated air pollution, saw a significant drop in preterm births.[35]
For even more reasons why incineration is a losing proposition for communities, explore ILSR’s Resources Up in Flames fact sheet.
Renewable Trash is a Legal Oxymoron
Although incinerators ought to fail on their environmental and financial demerits, they often persist because state and federal lawmakers have labeled trash burning “renewable.”
Today, 23 states allow energy generated from burning municipal solid waste to be classified as “renewable” in statewide renewable portfolio standards (RPS) or goals. Two of these (California and Wisconsin) grandfathered existing solid waste incineration plants into their classification of renewable energy but do not allow new facilities to be included, while four others (Arizona, Colorado, Missouri, and Ohio, with no operating municipal solid waste incinerators) only allow the inclusion of municipal solid waste under certain conditions.
The following map, compiling data and analysis from state statutes, DSIRE, Energy Justice Network, Food & Water Watch, and Energy Recovery Council, illustrates the number of municipal solid waste incinerators in each state and which of these states classify the electricity produced from these plants as renewable in these state-level policies.
The overlap between where incinerators are located and where they are counted toward RPS or renewable goals is apparent from this illustration. Most incinerators operating today are located in places where they can count the electricity produced as “renewable.” Fifty-two or 68 percent of 76 operating incinerators are located in the 23 states that classify municipal solid waste incineration as a renewable source of energy. Furthermore, even states without currently operating incinerators, such as Utah, still allow for the purchase of out-of-state renewable energy credits,[36] leaving the door open for power purchased from waste incineration in neighboring states.
When waste incineration is included in definitions of renewable energy, states make these plants eligible for renewable energy subsidies and further enable them to sell the power they produce to the grid,[37] as a recent report from Food & Water Watch illustrates.[38]
In Maryland, for example, the passage of State Senate Bill SB 690 [39] in 2011, meant the state became the first (and still, only) to elevate trash incineration to a “Tier 1” resource in its RPS putting incineration in direct competition with wind and solar and allowing it to capture much more valuable renewable energy credits. The Wheelabrator incinerator in downtown Baltimore, earned an estimated $10million in subsidies between 2011 and 2017[40] through Maryland’s Tier 1 renewable portfolio standard funding program, a limited pot of funding that drew resources away from wind and solar projects. This policy change also allows the amount of energy from incineration eligible for subsidies to grow over time.
Two notable exceptions to the strong association between statewide RPS and locations of municipal solid waste incinerators are Florida and New York. Florida, which has not yet passed any statewide RPS or goal, provides other types of incentives to incineration technologies and has 11 waste incinerators in operation today, the most of any state. New York, on the other hand, has a state RPS that excludes municipal solid waste incineration, yet it has ten currently operating incinerators. Since 2011, industry lobbyists have tried unsuccessfully to convince lawmakers in Albany to have New York follow Maryland’s lead and elevate waste incineration in the state’s renewable energy policy.[41] Recent proposals for new incinerators in New York have also faced strong opposition, including from high-profile officials like Governor Cuomo (D-NY) who cited environmental concerns for a recently proposed plant in Romulus, earlier this year.[42]
The relationship between renewable portfolio standards and the location of incinerators is certainly important to the local communities and states in which these plants operate. However, interstate electricity transmission and distribution networks combined with renewable energy credits[43] allow incinerators to sell their power at a premium to buyers in nearby states, as well.[44] This ultimately widens the reach of these plants well beyond state boundaries and provides other mechanisms that help keep these aging plants online.
“When you hear about a state that has an RPS [Renewable Portfolio Standard], know it’s not just affecting that state, but that it can be propping up polluters in many states around,” Mike Ewall, director of the Energy Justice Network, explains.
In Maryland, for example, ratepayers reportedly spent about $84 million over the last decade to purchase 10 million unbundled, out-of-state renewable energy credits from Virginia[45]. The vast majority of these credits were reportedly from dirty energy sources, including from Virginia’s municipal solid waste incinerators.
While the web of state renewable policies and credits is complex, the solution is simple.
Promoting Energy Democracy and Waste to Wealth, Instead
Solid waste incineration wastes energy, wastes money, kills jobs, and pollutes local communities. State policymakers, local government officials, and advocates at the community level have the authority and a variety of tools to promote cleaner, cheaper, and economically superior options. Recommendations for taking action, follow.
First and foremost, reform state renewable energy laws to remove subsidies for garbage burning that suck jobs and wealth out of communities. Examples from incineration bans in Rhode Island and Delaware, or policies in the dozen states that explicitly exclude incineration from renewable energy goals, illustrate how states can design legislation that curtails waste incineration. By addressing concerns of grassroots groups most directly impacted by local pollution and renewable energy developers that must directly compete with dirty incinerators, such policies can help retire aging incinerators, prevent new plants from opening, and support cleaner, more cost-effective waste processing and energy sources.
Diverse grassroots advocacy efforts have been particularly effective at raising awareness and stopping the expansion of incinerators. Supporting efforts of these groups and closing harmful incinerators can lead to savings that can be reinvested in the community.
“Knowledgeable community activists the world over have fought to prevent construction of incinerators,” Neil Seldman notes. “Hundreds of projects have been cancelled or put on hold as a result of citizen opposition.”
In addition to strengthening legal definitions of renewable energy and supporting grassroots fights to close aging incinerators, local governments can adopt a suite of strategies that transform “waste to wealth” and build a more inclusive and sustainable local energy system, such as:
- Pay As You Throw – This unit pricing[46] strategy, which incentivizes customers to reduce their garbage bills by throwing away less, would translate to lower municipal disposal costs.
- Organics Recycling or Community Composting – Divert food waste into a community or home composting program to move toward zero waste programs. Collect the remainder at the curb, tapping small businesses and entrepreneurs for hauling to ensure dollars circulate locally.
- Robust Recycling, e.g. Dual-Stream – Implement a recycling method that encourages the separation of paper from other recyclables, in order to recover valuable materials and further reduce disposal costs associated with the management of municipal solid waste.[47]
- Solar Energy – To address local energy needs, cities can use initial savings from moving away from electricity or steam produced by waste incineration to construct distributed solar resources on municipal property, cutting city energy bills, generating cleaner electricity, and creating additional savings over time that free up resources for local government to support other programs or reduce taxes.
These recommendations outline some of the ways cities can and are taking action to build local self-reliance and a more sustainable future, but there are many other strategies to consider.
For specific policy ideas related to distributed generation and renewable energy technologies, as well as additional case studies of these policies in action, explore our Energy Democracy Initiative’s interactive Community Power Toolkit.
For additional policy ideas related to waste management, explore the Waste to Wealth Policy Library and Community Composting initiative.
Conclusion
Classifying trash burning as “renewable” energy is a dirty secret in many states’ renewable energy goals. Such policies have bolstered this aging, dirty, and costly industry at the expense of cleaner and cheaper sources of energy and waste management strategies.
Well-defined renewable energy goals that explicitly exclude municipal solid waste incineration or ban incineration outright are clear, straightforward policy solutions to this problem. State lawmakers can take the lead on closing this trash burning loophole. Strengthening renewable energy commitments and retiring aging incinerators are actions that grassroots coalitions of advocates from both anti-incineration and clean energy movements would readily support.
Eliminating waste incineration from definitions of renewable energy would have positive impacts for local communities and on the transformation of our energy system. When cities chose energy democracy and waste to wealth over riskier investments in waste incineration, they save money and give residents greater individual and collective choice in how both waste and energy are managed locally.
Notes
[1] Kurtz, Howard. 1987. “Landfill Closings Costly Crisis for the Northeast.” The Washington Post. Available at: https://www.washingtonpost.com/archive/politics/1987/12/14/landfill-closings-costly-crisis-for-the-northeast/f8130fc8-aa55-4681-a6e7-d5786e07c76d
[2] ILSR. 2017. “PURPA: A Quiet Death or Longer Life After 40 Years of Wholesale Electricity Competition?” Available at: https://ilsr.org/purpa-a-quiet-death-or-longer-life-after-40-years-of-wholesale-electricity-competition/
[3] Shaw, Bob. 2018. “Fire sale: $37 million garbage-burning power plant in Elk River.” Pioneer Press. Available at: https://www.twincities.com/2018/07/16/fire-sale-37-million-garbage-burning-power-plant-in-elk-river/
[4] Hesse, Paul, and Dale Sweetnam. 2016. “Waste-to-energy electricity generation concentrated in Florida and Northeast.” US EIA. Available at: https://www.eia.gov/todayinenergy/detail.php?id=25732
[5] Energy Justice Network Map. Available at: https://www.energyjustice.net/map/
[6] U.S. EPA. 2018. Advancing Sustainable Materials Management: 2015 Fact Sheet. Available: https://www.epa.gov/facts-and-figures-about-materials-waste-and-recycling/advancing-sustainable-materials-management
[7] Institute for Local Self-Reliance. 2018. Quarterly Power Plant Capacity Tracking. Available at: https://ilsr.org/tag/quarterly-power-plant-capacity/
[8] Hornstien, Frank. 2013. “Garbage burning emits significant amounts of toxic pollutants, particulates.” MinnPost https://www.minnpost.com/community-voices/2013/06/garbage-burning-emits-significant-amounts-toxic-pollutants-particulates/
[9] Energy Justice Network. 2018. “Incinerators are NOT “waste-to-energy” facilities.” Available at: https://www.energyjustice.net/incineration/waste-to-energy
[10] Global Alliance for Incinerator Alternatives (GAIA). 2004. “Incinerator Myths.” Available at: https://ilsr.org/wp-content/uploads/2012/02/incinerator_myths.pdf
[11] Morris, Jeffrey. 1996. “Recycling Versus Incineration: An Energy Conservation Analysis,” Sound Resource Management Group (SRMG) Seattle, Journal of Hazardous Materials, 47(1-3):277. Available at: https://www.sciencedirect.com/science/article/pii/0304389495001166
Morris, Jeffrey. 2005. “Comparative LCAs for Curbside Recycling Versus Either Landfilling or Incineration with Energy Recovery.” The International Journal of Life Cycle Assessment. Volume 10(4): 273–284. Available at: https://doi.org/10.1065/lca2004.09.180.10
[12] ILSR, GAIA, and Eco-Cycle. 2008. “Report: Stop Trashing the Climate.” Available at: https://ilsr.org/stop-trashing-the-climate/
[13] Hennepin County Environmental Services. 2011. “Hennepin Energy Recovery Center:
An urban waste-to-energy facility.” Available at: https://swana.org/Portals/0/Awards/2011Noms/Wasto_To_Energy_Gold.pdf
[14] Work on Waste. 1992. “Municipal Waste Incineration Banned in Rhode Island: Excerpts from Rhode Island State Senate Act 92-S 2502” and Available at: https://www.americanhealthstudies.org/wastenot/wn199.htm
[15] Ibid.
[16] Varghese, Romy, Michael Bathon and Linda Sandler. “Harrisburg Files for Bankruptcy on Overdue Incinerator Debt.” Bloomberg. Available at: https://www.bloomberg.com/news/articles/2011-10-12/pennsylvania-capital-harrisburg-files-for-bankruptcy-over-incinerator-debt
[17] Energy Justice Network. 2011. “We predicted the nation’s largest city bankruptcy — 8 years ago.” Available at: https://www.energyjustice.net/harrisburg-bankruptcy-predicted
[18] Buntin, John. 2010. “Harrisburg’s Failed Infrastructure Project.” Governing Magazine. Available at: https://www.governing.com/topics/transportation-infrastructure/Harrisburgs-failed-infrastructure-project.html
[19] Seldman, Neil. 2018. “California Down to Two Garbage Incinerators.” ILSR. Available at: https://ilsr.org/california-down-to-two-garbage-incinerators/
[20] Shaw, Bob. 2018. “Fire sale: $37 million garbage-burning power plant in Elk River.” Pioneer Press. Available at: https://www.twincities.com/2018/07/16/fire-sale-37-million-garbage-burning-power-plant-in-elk-river/
[21] Seldman, Neil. 2017. “Report: Why Should Baltimore Recycle More.” ILSR. Available at: https://ilsr.org/wp-content/uploads/2017/03/Why-Should-Baltimore-Recycling-More-Report-final.pdf
[22] Disposal costs at HERC have declined from an estimated $95 per ton (originally set to cover the facility’s costs) to a low of $65 per ton to attract enough waste from the area’s trash haulers in the earlier 2000s, and back to $85 per ton today.
Sources:
Clement, Douglas. 2005. “A burning issue: Garbage burners play a significant role in a few Ninth District states. For years, local governments have stoked the fire, but the flame appears to be dying.” Federal Reserve Bank of Minneapolis. Available at: https://www.minneapolisfed.org/publications/fedgazette/a-burning-issue
Hennepin County. 2018. “Solid Waste System Operating Manual.” Available at: https://www.hennepin.us/~/media/hennepinus/business/recycling-hazardous-waste/documents/hauler-operations-manual.pdf?la=en
[23]Hennepin County. 2018. See supra note 22.
[24] Platt, Brenda. 2017. “Infographic: Compost Impacts More Than You Think” ILSR. Available at: https://ilsr.org/compost-impacts-2/; Platt, Brenda. 2013. “Composting Makes Sense: Jobs through Composting & Compost Use.” ILSR. Available at: https://ilsr.org/composting-sense-tables/
[25] Seltenrich, Nate. 2014. “Waste Incineration Plants a Hard Sell for Cities.” The Daily Climate. Available at: https://www.govtech.com/fs/news/Waste-Incineration-Plants-a-Tough-Sell-for-Cities.html
[26] GAIA. “Toxic Air and Ash Emissions from U.S. Covanta and Wheelabrator incinerators: dioxin, mercury, and other toxic contaminants.” Available at: https://www.no-burn.org/toxic-air-and-ash-emissions-from-u-s-covanta-and-wheelabrator-incinerators-dioxin-mercury-and-other-toxic-contaminants/
[27] Energy Justice Network. “EPA eGRID 2010 CO2, SO2 and NOx Emissions Data for U.S. Electric Power Plants.” Available at: https://www.energyjustice.net/egrid
[28] Energy Justice Network. “Energy Justice Platform” Available at: https://www.energyjustice.net/platform
[29] JusticeMap.org, Energy Justice Communities Map, and U.S. Census. API. Accessed 2018. Available: https://www.justicemap-api.org/test/14.html
[30] Matheny, Keith, and Kat Stafford. 2018. “Detroit Renewable Power waste incinerator pollutes. Is DEQ doing enough?” Detroit Free Press. Available at: https://www.freep.com/story/news/local/michigan/detroit/2018/05/21/detroit-renewable-power-incinerator-pollution-deq/623615002/
[31] Zero Waste Detroit. 2018 “Detroit Incinerator: Environmental & Health Impact.” Available at: https://zerowastedetroit.org/our-work/detroit-incinerator
[32] U.S. EPA. 2002. “Fish Consumption and Environmental Justice.” Available at: https://www.epa.gov/sites/production/files/2015-02/documents/fish-consump-report_1102.pdf
[33] Ecocylce. 2011. “Waste-OF-Energy: Why Incineration is Bad for Our Economy, Environment, and Community.” Available at: https://www.ecocycle.org/files/pdfs/WTE_wrong_for_environment_economy_community_by_Eco-Cycle.pdf
[34] Energy Justice Network. “Trash Incineration More Polluting than Coal.” Available at: https://www.energyjustice.net/incineration/worsethancoal
[35] Shankman, Sabrina. 2018. “Premature Birth Rates Drop in California After Coal and Oil Plants Shut Down.” Inside Climate News. Available at: https://insideclimatenews.org/news/22052018/air-pollution-coal-power-plants-oil-health-risks-premature-births-california
[36] DSIRE. 2018. “Renewable Portfolio Goal: Utah.” NC Clean Energy Technology Center. Available at: https://programs.dsireusa.org/system/program/detail/2901
[37] Karidis, Arlene. 2016. “The 50 states of waste: How waste-to-energy definitions vary across the nation.” Waste Dive. Available at: https://www.wastedive.com/news/the-50-states-of-waste-how-waste-to-energy-definitions-vary-across-the-nat/416197/
[38] Food & Water Watch. 2018. “Report: Cleanwashing How States Count Polluting Energy Sources as Renewable.”
https://www.foodandwaterwatch.org/sites/default/files/rpt_1807_rpsnationalscores-web4.pdf
[39] Maryland State Senate Bill 690. Available at: https://mgaleg.maryland.gov/webmga/frmMain.aspx?tab=subject3&ys=2011rs%2fbillfile%2fsb0690.htm
[40] Seldman, Neil. 2017. “Baltimore Incineration Plan Could Get Millions in Subsidies Thanks to Maryland Law.” Available at: https://ilsr.org/baltimore-incineration-plan-could-get-millions-in-subsidies-thanks-to-maryland-law/
[41] Smith, Jennifer. 2011. “Trash burner wants ‘renewable’ tag, funds.” Newsday. Available at: https://www.newsday.com/long-island/trash-burner-wants-renewable-tag-funds-1.3324597
[42] Seldman, Neil. 2018. “In the Finger Lakes of New York, a Garbage Incinerator Proposal Comes Under Fire.” ILSR. Available at: https://ilsr.org/in-the-finger-lakes-of-new-york-a-garbage-incinerator-proposal-comes-under-fire/
[43] World Resources Institute. “Fact Sheet: The Bottom Line on… Renewable Energy Certificates.” Available at:
https://wriorg.s3.amazonaws.com/s3fs-public/pdf/bottom_line_renewable_energy_certs.pdf
[44] Energy Justice Network. “Renewable Portfolio Standards: Promoting Green Energy: The Free Market Approach vs. The Public Policy Approach.” Available at: https://www.energyjustice.net/RenewablePortfolioStandards
[45] Chesapeake Physicians for Social Responsibility. 2018. “Unbundled: How Renewable Energy Credits Undermine Maryland’s Transition to Clean, Renewable Energy.” Available at: https://static1.squarespace.com/static/54949381e4b05fcc6a96c5c6/t/5b55b5351ae6cf630bacf059/1532343614911/Chesapeake+PSR_report2018_72018+%284%29.pdf
[46] Seldman, Neil. 2016. “Gold in the Garbage: How Recycling Rates Could Be a Lot Higher.” Governing Magazine. Available at: https://www.governing.com/gov-institute/voices/col-pay-as-you-throw-higher-recycling-rates.html
[47] Seldman, Neil. 2018. “More Communities Switch to Dual Stream.” ILSR. Available at: https://ilsr.org/more-communities-switch-to-dual-stream/
This report originally posted at ilsr.org. For timely updates, follow John Farrell or Marie Donahue on Twitter, our energy work on Facebook, or sign up to get the Energy Democracy weekly update. For more on our anti-incineration and zero waste work, follow and bookmark ILSR’s Waste to Wealth and Composting for Community initiatives.
Banner Photo Credit: takomabibelot via Flickr (CC 2.0)
![]()
![]()
![]()
![]()