
For 100 years, most decisions about the U.S. electric grid have been made at the top by electric utilities, public regulators, and grid operators. That era has ended.
Key Links:
Executive Summary
For 100 years, most decisions about the U.S. electric grid have been made at the top by electric utilities, public regulators, and grid operators. That era has ended.
Small-scale solar has provided one-fifth of new power plant capacity in each of the last four quarters, and over 10 percent in the past five years. One in 5 new California customers of the nation’s largest residential solar company are adding energy storage to their solar arrays. Economic defection––when electricity customers produce most of their own electricity––is not only possible, but rapidly becoming cost-effective. As the flow of power on the grid has shifted one-way to two-way, so has the power to shape the electric grid’s future.
The shift of power into customer hands is already having three, unintended consequences:
- Legacy, baseload power plants are becoming financially inferior to clean energy competitors.
- Electricity sales have stagnated as customers reduce use and produce electricity for themselves.
- Communities are reaping greater economic rewards from power generation, as electric customers, individually and collectively, produce more locally.
Almost no utility or utility regulator is adequately planning for this fundamental shift. Dozens of utilities across the country have proposed new gas-powered generation that has little chance of remaining online through the end of its economic life due to stiff competition from solar-plus-storage. Some have been approved despite substantial gaps in the economic analysis.
Utility have also made reactionary moves, or made gestures inadequate to address the magnitude of system change. There tend to be three inadequate utility responses to the reversed flow of decision-making power:
- Utilities have damaged their reputations by resisting customer interest in distributed energy resources, sending lobbyists to preempt or curtail policies that reward customer-sited and customer-owned power generation.
- Utility investments in large-scale renewable energy have addressed environmental concerns, but these low-cost power purchases have not delivered reduce electricity prices for end users nor assuaged the interest in over 70 cities of reaching 100% renewable electricity more rapidly.
- Utilities have deployed utility-owned distributed energy resources, but in ways that withhold much of the economic or financial benefit from customers.
Regulators and state legislators cannot expect incumbent utilities to respond adequately because the rise of economical solar-plus-storage challenges the century-old assumption of a natural electricity distribution monopoly. Instead, electricity market rules should facilitate fair compensation for distributed energy resources and market participants where technology already allows them to compete.
This report details recommendations for changing utility oversight and modifying electricity markets to transition from the dying utility distribution monopoly to a vibrant, democratic energy system where customers have the opportunity to choose distributed energy options that benefit themselves and the greater grid.
Solar + Storage Comes to Market
Utilities don’t have time to prepare for a future with economical, distributed energy storage because it’s on the doorstep. In 2016, the first hints of a storage-driven transformation of the electricity business came as a “postcard from the future” in Hawaii. Sunrun offered their Brightbox, a combination solar-plus-battery product with a price of 19 cents per kWh, almost 50 percent cheaper than grid electricity. Sunrun began offering its Brightbox service in California in December 2016. By 2018, 1 in 5 new residential Sunrun solar customers in California were choosing to add storage.
These early adopter states just scratch the surface of the competitive landscape.
Based on a proxy measure of electricity prices, the combination of on-site solar and energy storage can already compete with the price of serving nearly 26 million residential electricity customers in 19 states.1 The ILSR model compares customers installing a 7-kilowatt-hour Tesla Powerwall and a 5-kilowatt solar array to utility electricity prices, with the percentage of each state’s customers who can generate cheaper power themselves shown on each state:2
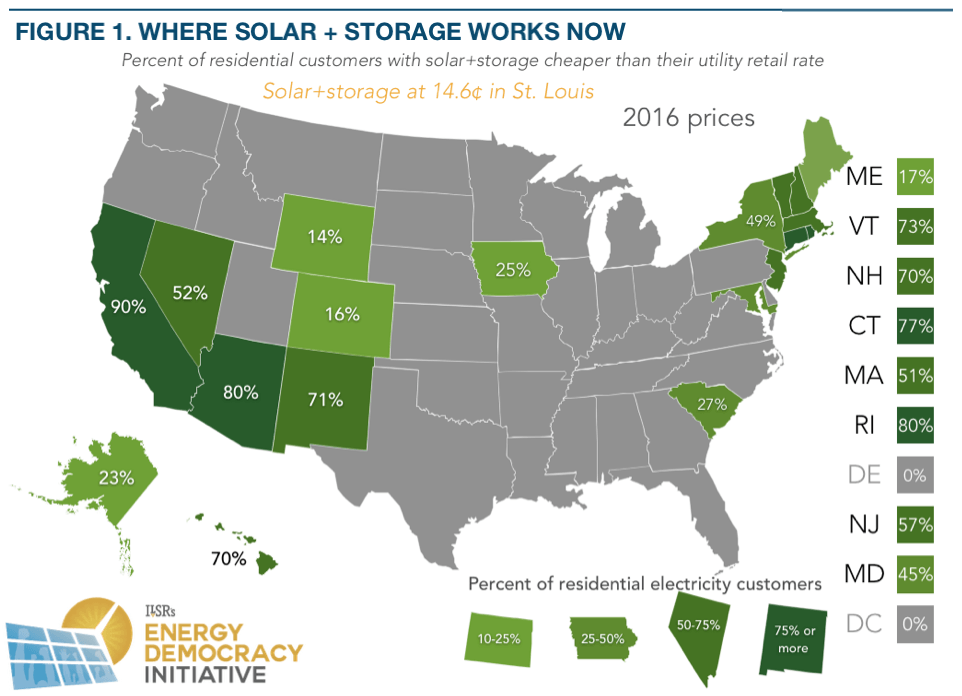
 ILSR’s analysis isn’t alone. According to McKinsey, within three years an Arizona electric customer would be able to serve 80 to 90% of their electricity needs with solar and battery storage, at a lower price than by buying electricity from the utility company.
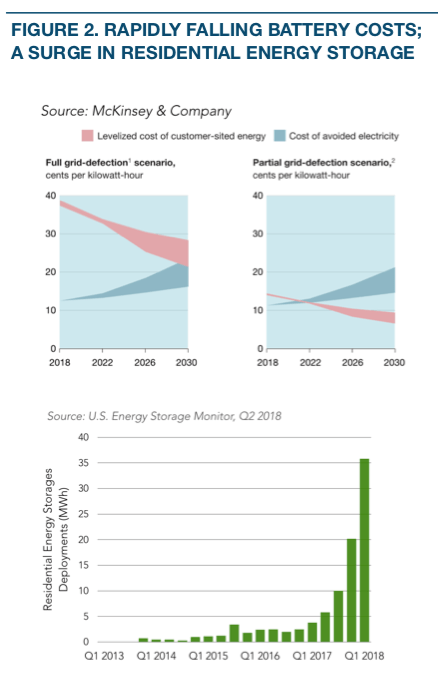
Storage prices have fallen remarkably fast, as illustrated by the remarkable price declines for battery storage technology in the last three years (measured in the cost of energy averaged over the expected life of the battery).
Customers have responded to the falling costs, with a surge in new installations of residential energy storage in the past year.
Although few residential customers would find it practical, full grid defection––or cutting the cord to the grid—could be at price parity within 10 years.
Business customers managing larger facilities have it even better. A 2017 analysis of solar and storage for affordable housing facilities in Chicago found that adding energy storage reduces the payback for solar from 20 years to 6 years by helping manage facility demand charges.
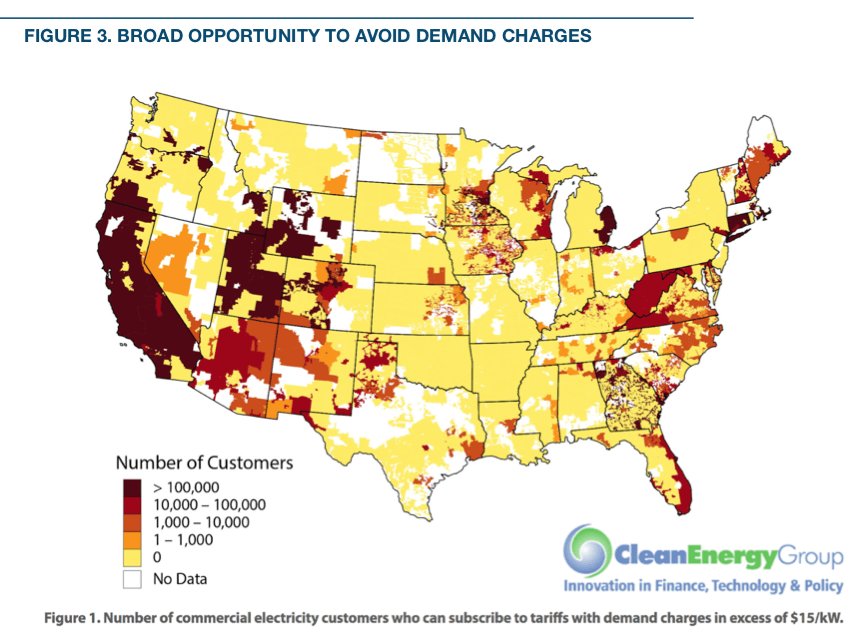
A broader report, also from 2017, suggests that commercial storage (alone) could be economic for one in four commercial electricity customers nationwide. Many commercial electricity customers have a demand charge, a portion of the electric bill based on a one-hour window of peak energy use each month, and representing half of many businesses’ bills.3 Solar energy alone is insufficient to avoid this charge, but a relatively small battery can lower that peak. The following map from the report shows particularly robust opportunity in the Southwest (coinciding with excellent solar resources), but also in the Upper Midwest, West Virginia, and much of New England.

 The prospects for solar+storage are even more remarkable in the near future. The following chart shows forecast steep declines in battery costs––by half in the next five years, and by two-thirds by 2030.
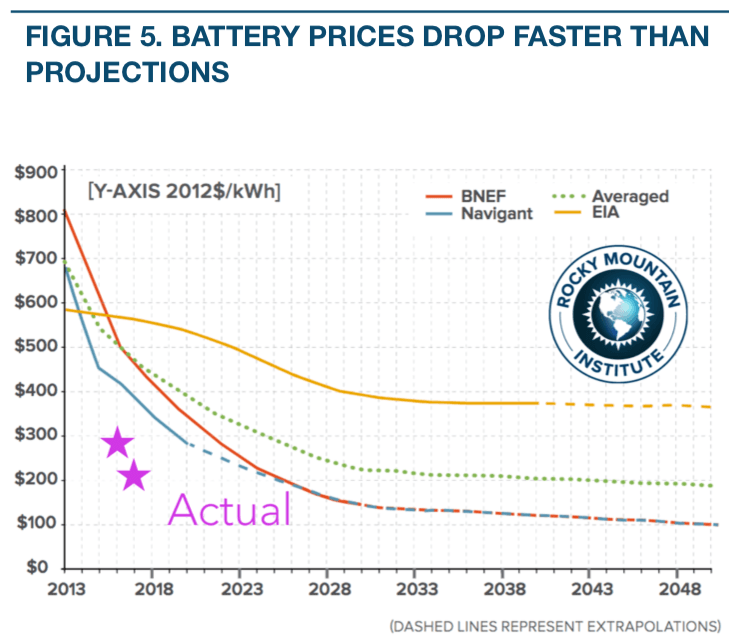
Batteries aren’t just getting cheaper, they’re doing so at a rate far outstripping predictions. A 2014 report from Rocky Mountain Institute featured several battery price projections, including one from Bloomberg. At the time, Bloomberg projected batteries crossing the $300 per kilowatt-hour threshold in 2022. Three years later, Bloomberg showed that batteries reached that price point in 2016; by 2017, battery pack prices had fallen another 30%.
How do rapidly falling costs change the calculus of solar plus storage?
If the Powerwall cost forecast by GreenTech Media comes true––halving the cost––and solar continues a modest 3-4% reduction in the cost per year, in 2022 nearly half of all residential electricity customers (in all but 4 states) will be able to get electricity as affordably from their rooftop and a battery than from the utility company.4 The following map provides a stunning contrast to the one based on today’s prices (page 3).

Storage costs and forecasts are a clear warning to utilities that customers will be able to leverage batteries (and solar) for much more control of their energy bills than ever before.
Grid Implications
Energy storage increases the value of rooftop solar installations to customers––providing resiliency to utility outages and allowing them to avoid new utility fees. It’s no wonder that, as noted earlier, 1 in 5 Sunrun solar customers in California opted for storage in 2017.
The collective decision of California customers also offers valuable grid services. For example, California residents and businesses already host nearly 6 gigawatts of solar. If half of these existing solar households added a Tesla Powerwall (with 7 kilowatt-hours of storage and a maximum draw of 2 kilowatts) and half of solar businesses added a 50-kilowatt Tesla Powerpack (with 210 kilowatt-hours of storage), California electric customers could provide 1.19 gigawatts of power for 3.5 hours. That’s enough to significantly reduce the state’s evening grid peak during its full duration. The chart below illustrates:
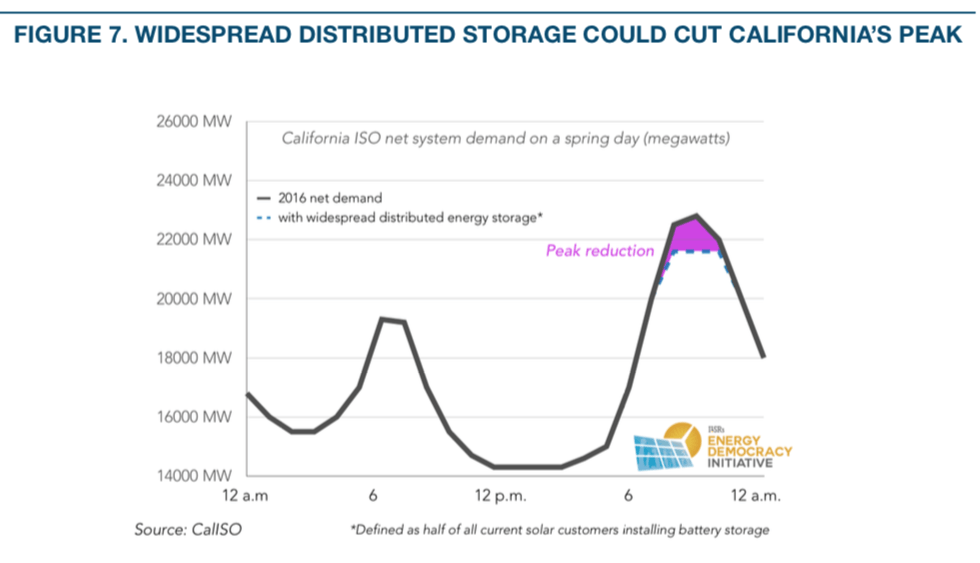
Electric cars, adopted for their ability to cut the cost of car ownership, could do far more. If connected to the grid in a way allowing for their batteries to be tapped, “The 1.5 million electric cars California expects by 2025 would have a maximum energy demand of about 7,000 megawatts, more than double the capacity needed to substantially smooth the current afternoon rise in peak energy demand.”
Batteries can also supplant fossil fuel generators in helping stabilize the grid. An electric grid requires a delicate balancing act of supply and demand, every second of every day. One technological advantage of battery storage over most other grid resources is that batteries act fast, nearly instantaneous. Batteries supply short bursts of power to keep the grid’s voltage and frequency steady at a lower cost than big power plants and turbines operating on standby.5
In the U.S. Mid-Atlantic region, the grid operator PJM requested such “ancillary services” that included markets for frequency and voltage regulation markets for smaller producers (a minimum size of 100 kilowatts). The lucrative prices––$40 to 50 per megawatt-hour––and low threshold for participation supported development of dozens of energy storage projects. Several hundred megawatts of battery storage entered the PJM market in response to the opportunity, many doing double-duty by providing crucial services to their owners, not just the grid.
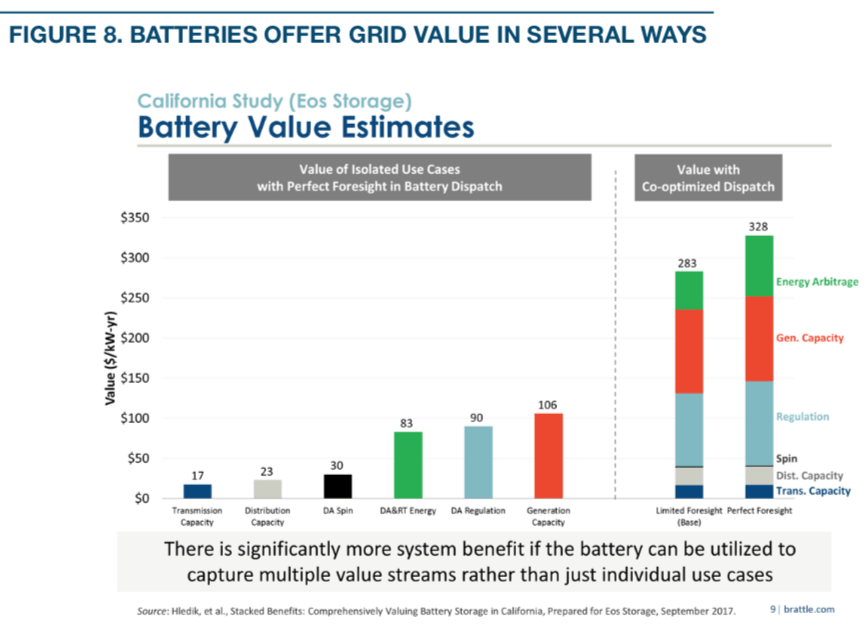
Changes in market rules and reduced costs for gas competitors have since reduced the financial opportunity in the Mid-Atlantic, but batteries can still provide value to their customers and the grid in other ways. A study for the California market showed no fewer than six value streams for battery operators aiding the grid, as illustrated below. The first two bars represent the value of additional capacity freed up on the transmission and distributed system by storing excess local energy. The third bar is the ability to provide reserve energy on a moment’s notice, and the fourth represents the value of actually delivering that energy. The fifth bar shows the value of helping regulate the grid’s voltage and frequency to keep it stable. The final bar represents the reduced need for power generation capacity that can be supplied by storage.
In addition to the Mid-Atlantic and California examples, markets are likely to open in other regions soon. A 2017 directive from the Federal Energy Regulatory Commission requires all grid operators to adopt rules recognizing the many values of energy storage and allowing firms to aggregate many small storage projects into large ones.
If customer-sited distributed energy resources can access the financial compensation for their value, customers will likely take opportunities to reduce their energy costs through greater self-reliance. The implication for utilities is clear: be wary of making substantial, centralized infrastructure investments when decentralized technology has significant advantages, can be online sooner, with decisions made by folks outside your boardroom. The following section explores the implications of the competition from distributed energy resources.
An Inadvertent Triple Threat
Locally generated power from solar-plus-storage can undercut the century old utility model––centralized power plants sending electricity long distances over high voltage transmission lines––in three ways.
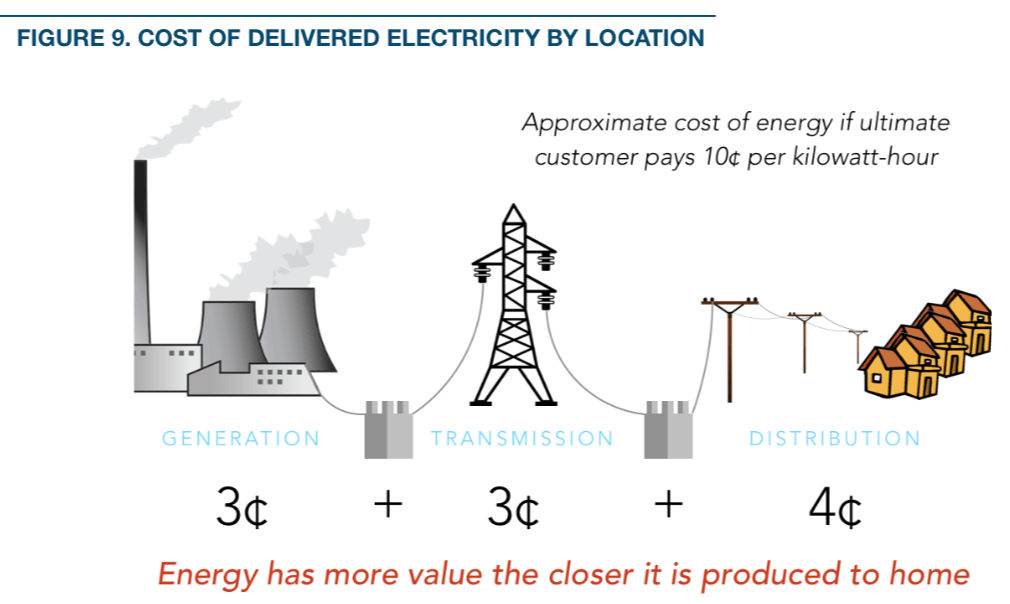
First, it has higher value. If the cost of delivering electricity to the ultimate customer is 10 cents per kilowatt-hour, a typical utility’s costs are split between generation (about 3 cents), transmission (about 3 cents), and distribution (about 4 cents). Power produced at the power plant is worth far less than energy delivered into the customer’s home or business. The following graphic offers an approximation of the typical utility’s cost structure for delivered electricity.
Second, distributed energy resources can be deployed more quickly, in months rather than years, and the price often decreases in the time it takes to plan and finance a centralized power plant.
Third and most striking, the decision to deploy distributed resources is relatively independent of centralized power plant development. Utilities don’t do distribution planning and customers don’t consult utilities when installed distributed energy resources, despite clear effects on one another.
California provides a powerful illustration of how the combination of thousands of individual actions presents the collective triple threat. Over 700,000 solar arrays in California were installed because of simple economics––rooftop energy generation from sunshine costs customers less than utility power and customers and third party marketers were given a chance to access that value. Most of these arrays were built in the last 10 years, less than a typical utility’s 15-year resource plan and in much less than the average power plant lifespan (40 years or more). Unused to competition or planning on such a short timescale, California utilities were caught flat-footed.
Death of “Baseload” and Fossil Fuel Power Plants
The economics of coal and nuclear power plants have for years relied on operating at high capacities around the clock. But with energy efficiency and distributed energy lowering demand; utility-scale solar and wind cutting into sales with cheaper, cleaner electricity; and now, with the advent of energy storage, these power plants struggle to compete. Utilities operating non-competitive plants in Ohio and Illinois have sought subsidies to keep these “baseload” plants operating. Some power companies have even lobbied the federal government to provide a backdoor subsidy by rewarding power plants with on-site fuel storage (a backhanded swipe at wind and solar that could misfire as these systems add battery storage). The competitive threat also applies to new power plants, where the rapidly falling costs of distributed energy make slow-to-build, long-term investments very risky.
A Nuclear Plant Retires
The Diablo Canyon nuclear power plant, in San Luis Obispo County, Calif., is a prime example of threat to incumbent power plants and the potential for innovative solutions.
Completed in 1985 and 1986, the Diablo Canyon facility provides close to 9% of the electricity used in California. Operating licenses for the two reactors expire in 2024 and 2025, with the utility seeking license renewals. However, as the state’s electricity market has become increasingly dominated by low-cost wind and solar resources (with very low operating costs), the nuclear plant’s electricity was no longer competitive (five other nuclear reactors were shuttered nationwide in 2013 and 2014 alone). The combination of poor revenue outlook and pressure from environmental organizations led the utility to a settlement agreement in 2016. Per the proposed settlement, the utility would retire both units and replace their capacity with “a combination of renewable energy, efficiency and energy storage.”
Unfortunately, the settlement agreement was undercut by an early-2018 order from the Public Utilities Commission. Commissioners removed community transition funds (focused on replacing lost property tax revenue) and employee retention; instead, the state legislature has taken up these issues. The Commission order also deferred the replacement power decision to the utility’s next resource planning process. It’s an illustration of how siloed decision-making in the electricity business makes it hard to plan for an orderly retirement of legacy power plants.
The following map provides some indication that this case study is more than a California problem for legacy power plant owners. It shows the cost of a 100% electricity supply overlaid with nuclear power plants Bloomberg has identified as having marginal economics.6 In today’s grid, with significant reserves of on-demand power plant capacity, solar and wind can entirely replace a retiring baseload power plant like Diablo Canyon.
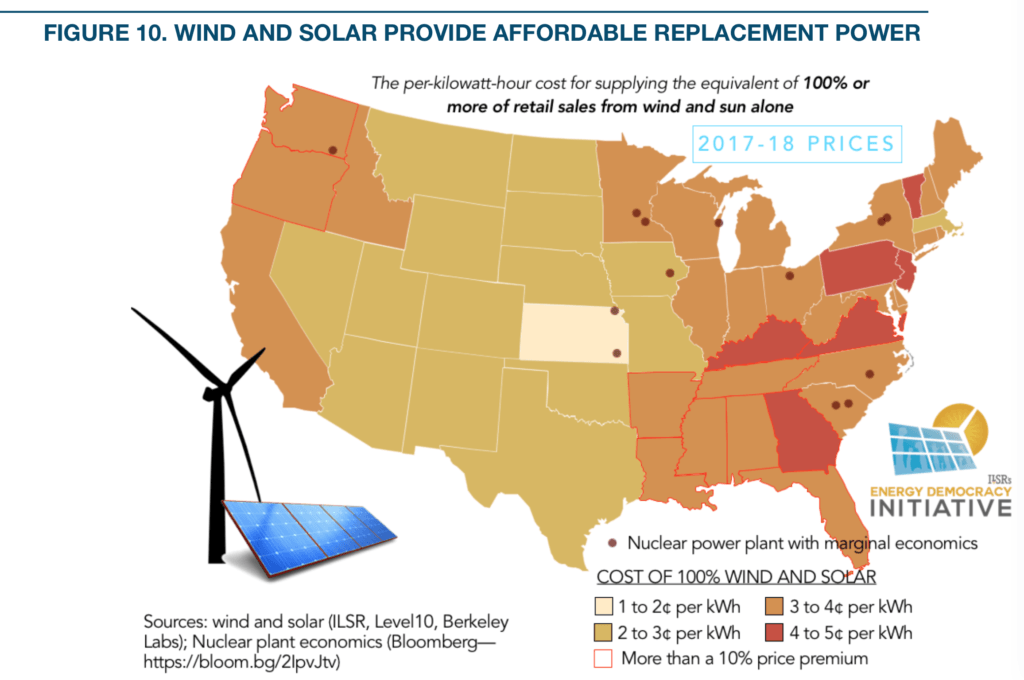 The stunning result is that renewable replacement power is very low priced, at 3 to 4 cents per kilowatt hour or lower, in every state with a nuclear power plant operating on the margins. Replacement power from new renewables is likely cheaper than most existing generation in all but eleven states (bordered in red).7 Even in those states, the difference is less than a penny per kilowatt-hour.
As the grid shifts toward renewables, wind and solar energy alone won’t suffice to provide round-the-clock supply. But as subsequent sections of this report reveal, the past and future cost declines for storage make renewables a potent threat to existing (and planned) centralized power plants.
A Gas Plant Evaporates
In 2015, NRG Energy asked California state regulators to certify the need for a new 262-megawatt gas power plant in response to a request from Southern California Edison. The Johnson City, Calif., combustion turbine “peaking” power plant was meant to replace existing capacity from power plants that could no longer comply with new state water use rules. By early 2018, it looked like the power plant proposal was dead. What happened in those three years?
In short, a dramatic drop in the cost of storage.
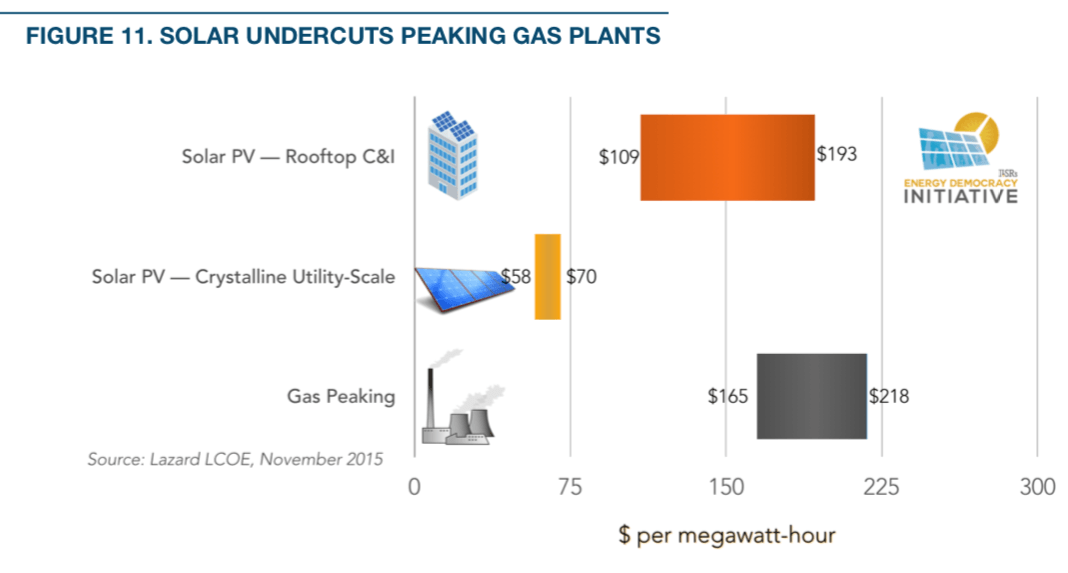
Even at the time of its proposal, the Johnson City gas plant was up against low-cost renewable energy, as was the Diablo Canyon nuclear plant. This chart, from the 2015 annual cost of energy analysis by investment bank Lazard, shows that solar PV was much cheaper than a gas peaking plant like the one proposed by NRG. Peaking plants run infrequently but are used to fill in power supply during periods of high demand. Even rooftop scale projects were competitive with the proposed peaker on a cost of energy basis, but utility-scale solar electricity was half as expensive.
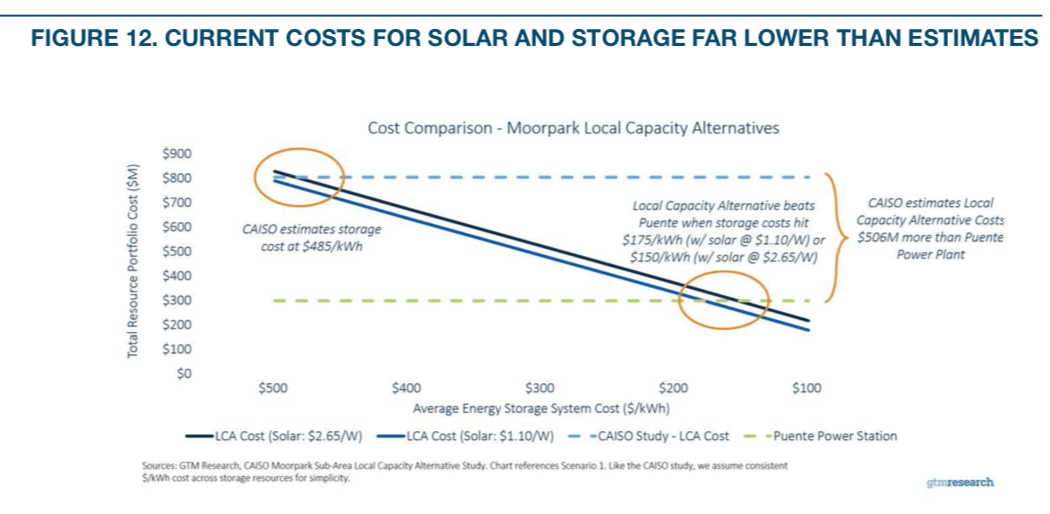
Given the relative costs, the state’s grid operator, CAISO, ordered an analysis of alternatives to the gas plant including distributed energy and energy storage. The report came back with dramatically negative conclusions: the cost of alternatives was as much as three times higher to fulfill the capacity need at the nearby Moorpark substation. But analysts from Greentech Media pounced on the results, noting that the cost estimates were as much as three years old, in a market that changes rapidly. Their analysis was more nuanced and much better for the alternatives to the gas peaking plant: If the upfront cost of electricity storage could hit $175 per kilowatt-hour or lower (depending on the cost of solar), the non-gas alternatives including solar would actually be the less expensive resource. The following chart illustrates:
Lower costs for both solar and storage contributed to Greentech Media’s results. In its 3rd quarter 2017 report, the Solar Energy Industries Association reported utility-scale solar costs of $1.10 per Watt or less, and costs for non-residential solar (think large rooftops) of $1.55 per Watt. The cost of solar has been falling and falling faster than the cost of gas-produced electricity. A 2017 update to the Lazard cost-of-energy illustrates.
Energy storage is also relatively inexpensive and becoming even more so. In a late 2017 update, a Bloomberg analysis priced battery packs at $209 per kilowatt-hour, less than half as expensive as the CAISO model for the Johnson City Plant.

A new study published in Nature by professors from University of California Berkeley lent more fuel to the fire, skewering prior battery price forecasts as too conservative and suggesting that by 2018 battery packs would already be inexpensive enough––well under $175 per kilowatt-hour––to affordably supplant the Johnson City gas plant. The prices below indicate the upfront cost per kilowatt-hour of capacity.
 Given the new data, in October 2017, CAISO recommended a new request for proposals to allow for renewable energy and storage to bid in at more current prices. NRG has suspended its application for the plant.
The Johnson City plant may be the “canary in the gas plant” for the economic threat of “preferred resources” (renewables and storage) to replace gas peakers. In Minnesota in 2015, state regulators gave the green light to a solar project rather than a utility-proposed expansion of gas. In January 2018, the California Public Utilities Commission ordered Pacific Gas & Electric to seek storage and renewable energy replacements for three existing gas peaker plants. Combination wind or solar plus battery storage systems responding to an Xcel Energy Colorado request in early 2018 had levelized cost offers far less than $100 per megawatt-hour (although storage duration was not disclosed). In February 2018, Bloomberg reported on another bid won by solar plus storage:
In just the latest example, First Solar Inc. won a power contract to supply Arizona’s biggest utility when electricity demand on its system typically peaks, between 3 p.m. and 8 p.m. The panel maker beat out bids from even power plants burning cheap gas by proposing to build a 65-megawatt solar farm that will, in turn, feed a 50-megawatt battery system.
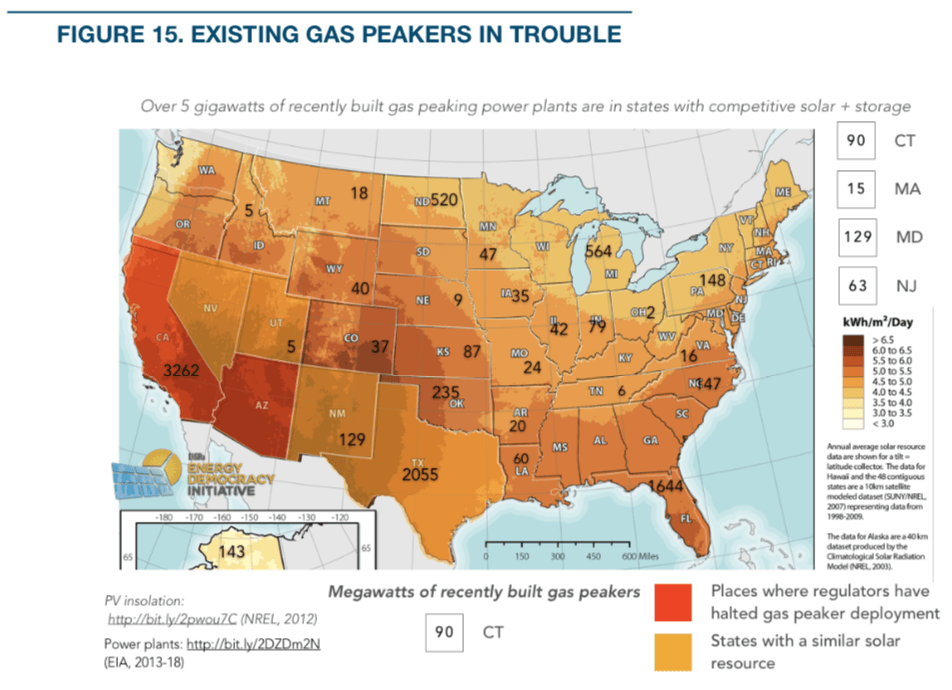
Johnson City may also hint at problems for recently built gas power plants. Over 5 gigawatts of gas peakers were recently deployed in states that have, or will have soon, economical competition from solar and energy storage. Customers in California, Nevada, Arizona, and New Mexico can already access solar and storage combinations competitive with utility power prices. Regulators in two of these states, California and Arizona, have recently slowed or halted gas peaker deployment in response to these cost-competitive threats from distributed and centralized renewable energy plus storage.
The long timeframe for planning, constructing, and operating large-scale power plants doesn’t do the industry any favors. The Johnson City, Calif., plant wouldn’t have started producing electricity until 2022 and would have saddled electric customers with expenses for 40 years. Alternatives––including distributed solar, demand response, and energy storage––can be constructed in a much shorter timeframe (months, instead of years), and have been getting cheaper every year.
Pain for Utility Balance Sheets
Competition from distributed energy may also sharply reduce sales. High electricity prices drove nearly 20% of Hawaiian Electric customers to install solar arrays by late 2017. With help from public regulators, the utilities won a reduction in compensation for rooftop solar producers. But within months, third parties started offering island customers combination solar and energy storage packages capable of providing electricity cheaper than the utility offered.
With competitive solar plus storage, Hawaiian electricity companies could be reluctantly mailing “postcards from the future” about the financial challenges of accommodating customers with less expensive options.
If just 2 in 10 Hawaiian residential and commercial electricity customers exercised their choice and had solar plus storage (either by retrofitting a battery onto their existing solar or buying a bundled system) it could cause a net reduction in Hawaiian Electric Company electricity sales of nearly 950 gigawatt-hours per year, or just over 10% of total sales. At today’s electricity prices (and ignoring many other benefits of avoiding oil-based power generation) it would cost the company over $250 million per year in lost revenue (about 11% of total revenue and more than the utility’s $167 million net income for 2017).
Bigger Local Economic Returns for Communities
Distributed solar and storage not only undercut the economics of centralized utility power plants, they can boost local economies in ways utility-built power plants don’t. The failed Puente gas plant provides a powerful example.
The proposed gas peaker would have supplied 271 megawatts of peak power for an upfront cost of $250 million dollars (and millions more for fuel consumed). The cost of energy from the plant would have been above $150 per megawatt-hour, with at least half of that energy cost leaving the community to pay for imported fuel.
ILSR modeled distributed solar and storage replacement options for the Puente gas plant and found a solar and storage hybrid with a higher upfront cost but much lower lifetime cost, and substantial local economic benefits.
The key element is replacing the peak energy supply from the proposed Puente plant. To understand what is needed, the following chart from Southern California Edison illustrates their peak energy demand on a summer afternoon, shown below in green. The tiny black triangle shows the area, up to 271 megawatts, at the peak of the curve, that the Puente gas project would likely have fulfilled.

ILSR modeled three, combined strategies to meet the 271-megawatt peak: demand reduction, solar energy, and battery storage.
We assumed there were sufficient opportunities to reduced energy demand by about 11 megawatts, equivalent to 4% of the Puente capacity. This is based on ILSR’s research on peak demand opportunity and is certainly conservative (this model only factors in residential demand response, despite commercial demand response opportunities being much larger). Demand reduction was priced at $300 per kilowatt, based on California utility demand response programs.
Of the remaining 260 megawatts of capacity, solar energy can only fulfill 30 megawatts of the peak energy use during the peak hours, because south-facing panels have limited production at that time of day. So, we modeled the installation of 292 megawatts of solar using the low sun angle to provide 30 megawatts of peak-time power as well as 230 megawatts of solar energy that could be stored for later use. ILSR assumed a split of 80% non-residential solar arrays and 20% residential solar, with a weighted average solar installed cost of $1.88 per Watt ($1.60 per Watt non-residential, $3.00 per Watt residential). The total cost for this distributed solar power plant is about $550 million.
The final piece for this modeled scenario is 230 megawatts of battery storage, assumed to cost $175 per kWh, for a total cost of approximately $40 million. Given the favorable economics under California’s “Net Metering 2.0,” it’s assumed that energy storage is co-located with all non-residential solar projects (about 64 megawatts). If half of residential solar customers also opted for storage (e.g. a Tesla Powerwall), it would account for a further 11 megawatts of storage.

The total cost for the solar and storage alternative is $589 million (about twice the upfront cost of the proposed Puente plant), but with a levelized cost nearly two-thirds lower, less than $50 per megawatt-hour.#
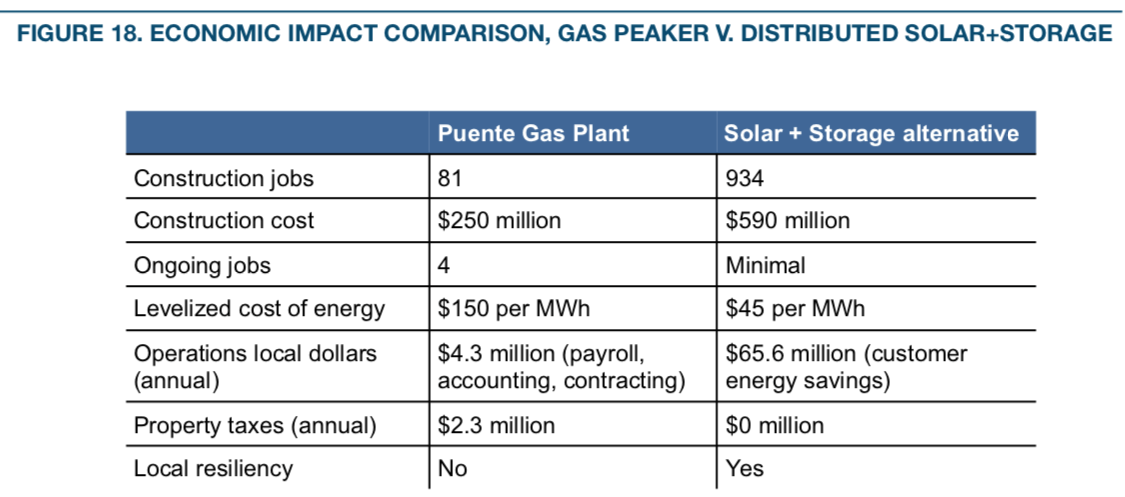
In addition to these energy cost savings, the distributed solar and storage solution also offers premium jobs and local economic benefits. The following table compares the construction and operations jobs and cash flows from the two options. A peaking gas plant offers a handful of more long-term jobs, but that value is swamped by the enormous economic benefit to customers whose solar and storage systems cut their energy costs.
Reversing the Power Flow
The combination of solar and energy storage won’t mean every customer is their own utility, but it reverses 100 years of top-down decision making by granting customers much greater choice. The reversal brought about by affordable energy storage akin to a fourth horseman of a utility business model apocalypse.10 As with the mythical riders, energy storage joins energy efficiency, distributed solar, and information technology to threaten the utility’s economic monopoly.11
Energy storage doesn’t end the utility of the electric utility, but––combined with distributed rooftop solar––it continues the shift away from monopoly power toward energy democracy. In particular, promises to nearly sever the reliance of electricity customers on a central utility company because it allows customers to avoid utility-imposed charges and to arbitrage (buy at low prices, sell at high prices) the time-of-day differential in the cost of electricity generation. It also gives them unprecedented access to grid value and revenue streams. Utilities will need to offer customers a reason to stay connected.
Unfortunately, many are doing the opposite.
Another Bonfire of Risky Spending?
Despite the evidence that economics and customers will continue to drive distributed energy, many utilities are forging ahead with major power plant construction plans. Across the country, utilities have over 60 gigawatts of new gas power plant capacity in the queue for the next four years alone, 50 percent more capacity than is expected to be retired counting nuclear, gas, and coal combined.
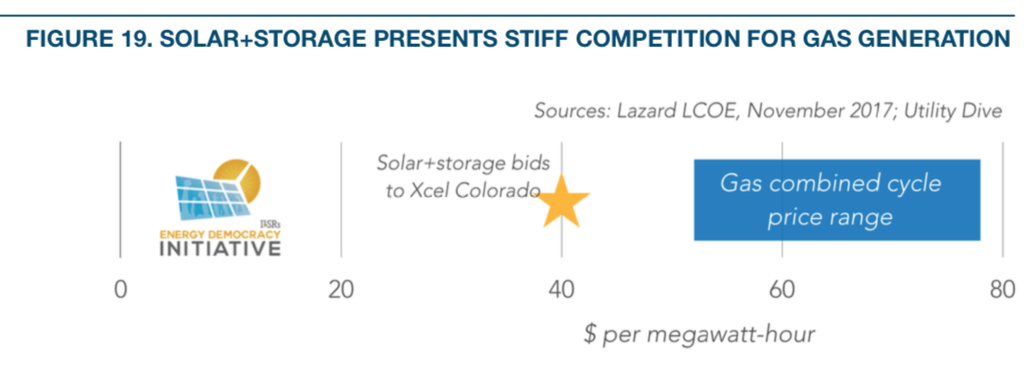
This planned gas capacity will have stiff competition. On one hand, distributed generation will reduce the demand for conventional energy generation, both baseload and peak, as well as ancillary services. On the other hand, bids for utility-scale renewable energy combined with storage are coming at prices unimaginably low. When Xcel Energy in Colorado received bids for new power plants slated to start delivery in 2023, it found it could buy wind or solar paired with storage for less than $40 per megawatt-hour, far less than the expected cost of energy from a new gas combined cycle power plant.
The competitive threat also applies to “peaker” plants that provide capacity during periods of peak demand but operate at relatively low efficiencies. Almost three-quarters of the 13 gigawatts in planned capacity is scheduled for states with competitive solar and energy storage now or in the near future. Writ large, Greentech Media analysts suspect that energy storage alone will compete with gas peakers on price by 2022, and beat them consistently within a decade.
Already, regulators are increasingly challenging company plans to build new gas plants:
Some utility companies have scrapped plans for new natural-gas plants in favor of wind and solar sources that have become cheaper and easier to install. Existing gas plants are being shut because their economics are no longer attractive. And regulators are increasingly challenging the plans of companies determined to move forward with new natural-gas plants.
“It’s the No. 1 Power Source, but Natural Gas Faces Headwinds,” New York Times, March 28th, 2018.
The following map shows the capacity of planned gas peaking plants across the country, highlighting states that have a solar resource similar to states––California and Nevada––that have halted gas plant development to consider economical solar plus storage alternatives.

Some planned plants have already died. As mentioned earlier, California regulators have ordered a recent gas plant proposal (Johnson City) back to the drawing board to take competitive bids from renewable sources and energy storage, and energy company NRG recently announced retirement of three other gas peakers for “economic reasons.” Arizona regulators recently put a moratorium on gas plant construction to come to grips with economical solar and storage alternatives.
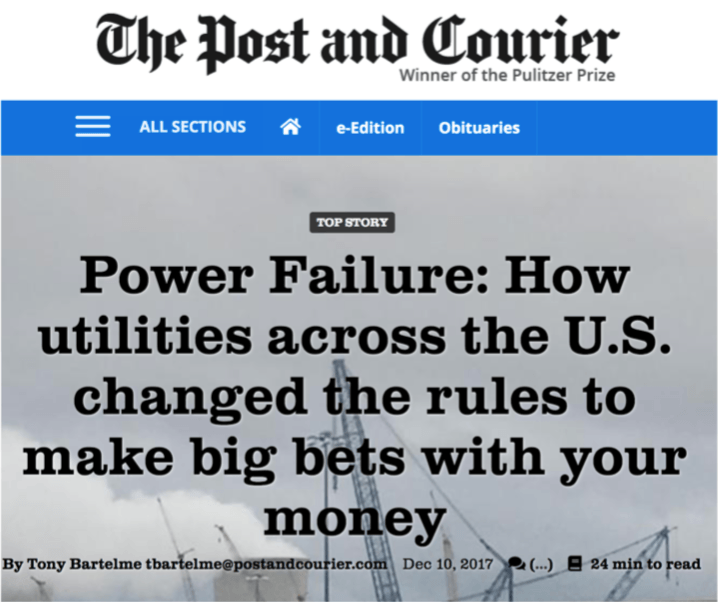
When independent power producers plan new power plants, they have to decide whether the market will buy their product in the long run. But many utilities have captive customers. When their plants fail to pay back, they become “stranded assets.” Journalists in the U.S. Southeast recently broke a major story on a $40 billion “bonfire of risky spending” by monopoly utility companies on nuclear power plants and carbon-capture coal power plants that will never produce a kilowatt-hour, but will cost their customers for decades.
In the 30 states where public regulators must approve new power plant construction, especially states like California and Florida, where utilities have big plans, commissioners should be very cautious about any new capacity proposals. New gas could be very expensive, weighing down those who can’t finance an escape from utility charges via rooftop solar and on-site storage.
Utilities Respond Inconsistently
Responses by utilities to the changing technological and political landscape vary widely. Some are aggressively hostile, trying to shut down their emerging distributed competitors. Some are building utility-owned solar and storage facilities. Some are establishing utility-owned rooftop solar systems.
Stopping Distributed Clean Energy Competition
The most common response of utilities to distributed energy options like solar and energy storage has been to try to stop them. Countermeasures include legislation to remove net metering (or other rules that guarantee customers fair compensation on their utility bills for installing solar) with 31 states considering policies related to distributed generation compensation in 2017 alone. With regulatory approval, utilities have also levied special fees on the electric bills of solar customers (19 utilities pushed proposals in 10 states in 2017). Finally, many utilities have proposed raising the fixed portion of the electric bill high enough to limit energy savings from any on-site resources, whether efficiency or solar energy.
Battery storage may undermine the utility playbook on stopping distributed energy. In Iowa, Alliant Energy’s standby tariff and high utility demand charges drove Luther College to examine how energy storage could continue its pursuit of a clean, resilient energy supply. A study by the National Renewable Energy Laboratory found that “Luther College could save approximately $25,000 in energy costs for each of the next 25 years if it installs a 1.5 [megawatt] solar array and a 393 [kilowatt] battery,” due in large part to the ability to avoid excessive demand charges by Alliant, totaling as much as 40% of the college’s monthly bill.
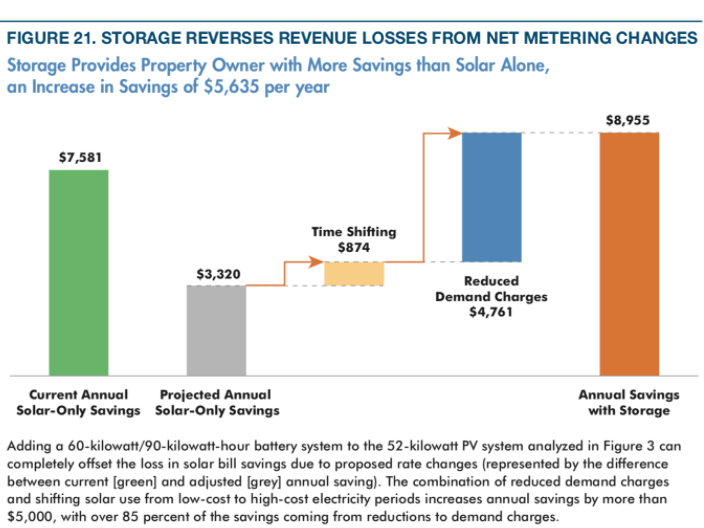
In California, changes to net metering compensation lower the financial value of distributed solar, sometimes significantly. But adding storage to projects can restore many of the lost savings. The following chart from a study by Clean Energy Group walks through the process. The first bar shows solar savings in the current regime, while the second shows the markedly reduced value of solar alone in the new regime. The two floating bars show the added monetary value of storage in time-shifting when the customer draws power from the grid and in reducing demand charges. The final bar shows the result, with greater savings by combining solar and storage than with solar alone.
In some cases, storage may allow affordable housing or other commercial rate customers to switch to rate plans without demand charges, increasing energy savings by two or three times.
Adopting Clean Energy at Utility Scale
Utilities convinced of competitive solar and storage sometimes embrace large-scale, utility-owned systems. Utilities have installed nearly 25 gigawatts of utility-scale solar and 600 megawatts of energy storage in the past five years. Over 85% of utilities expect increases in utility-scale solar and energy storage in Utility Dive’s 2018 annual survey.
This strategy has two benefits for utilities: many can still make money with large capital investments, and it weakens environmentally-driven arguments against the utility company’s monopoly.
On the other hand, utility-scale renewable energy investments compete with distributed solar and storage only to a degree. Some crucial grid services––helping maintain a consistent voltage––are best provided near load. Centralized solar and energy storage have a limited ability to meet such needs. If centralized renewable energy projects don’t lower the ultimate price of electricity, they also won’t address the customer who can produce cheaper electricity on-site or who values other benefits of local production, such as resiliency in the face of grid outages. Finally, many communities have now made commitments to get 100% renewable electricity, often within the next 15 years. If utilities don’t keep pace, their customers may move on without them.
Deploying Utility-Owned Distributed Clean Energy
Some utilities go beyond utility-owned large-scale clean energy facilities to embrace utility-owned distributed solar and storage. Several investor-owned utilities have muscled into the rooftop solar market, offering a roof rental fee to customers for hosting utility-owned solar panels. The offering aims to address customer demand for solar while keeping ownership, and profits, within the utility.
Our 2015 analysis revealed that utility-operated rooftop solar programs kept as much as two-thirds of the financial benefit typically seen by customers that owned solar on their rooftops (fortunately, in the case of Tucson Electric Power and others, utility-owned programs are small relative to the non-utility market). Notably, two of the utilities muscling into the rooftop solar market––Arizona Public Service and Tucson’s utility––have also tried to reduce compensation for customer-owned solar.
Other utility efforts operate in a gray area because the utility itself is customer-owned. Rural electric cooperatives have addressed customer interest in solar with options for customers to subscribe to solar projects not on their property. In some cases, these subscription models allow more customers to share in the economic benefit of solar and offer significant savings. In other cases, customers are simply asked to pay more for electricity when they could have saved significantly with their own solar installation.
Green Mountain Power stands virtually alone as an investor-owned utility offering distributed options for its customers. This Vermont utility finances Tesla Powerwall home battery packs for $37 per month and has boosted compensation for rooftop solar producers. It may be no coincidence that it’s also a B-Corporation, with a commitment to provide social and environmental benefits to customers and not just financial rewards to shareholders. As it happens, the two goals align well.
The problem with utility-provided distributed energy resources is less about the individual benefit to customers and more about customer choice. Utilities act as gatekeepers to the benefits of distributed energy resources through interconnection policies, rate structures, pricing, and market access for selling services like grid voltage or frequency. If offered in a competitive market, utility distributed energy services are a welcome addition to the customer’s choices. If not, they’re an extension of the monopoly to services that don’t require monopoly control.
A combination of the three tactics may slow the spread of distributed energy generation and storage. Anti-distributed energy policy can slow customer adoption. Building utility-owned clean energy at scale may undermine the sense of urgency in the environmental advocacy community. Offering utility-owned distributed generation can assuage customer interest in local clean energy and cut competitors out of the market.
The tension between customer-empowering solar+storage and the distribution grid monopoly market structure makes good rules imperative.
Solar + Storage Rules That Lead to Energy Democracy
Strong economics don’t make a distributed solar and energy storage revolution inevitable. As noted, utilities have already made efforts to weaken competition from customer-owned power generation. The following policy recommendations would allow the maximum grid and local economic benefit from the distributed solar and energy storage opportunity.
Utility Targeted Recommendations
Electric utilities must demonstrate their continued value in a competitive market—one in which their customers can choose cost effective alternatives to grid-delivered power. Energy market regulators and state legislatures should take the following actions on behalf of electric utilities and their customers:
- Issue a moratorium (like Arizona) on construction of new, large-scale fossil fuel power plants and require competitive bids from distributed energy resources to supply any new capacity needs
- Sharply increase requirements for utility acquisition of economic demand response (see Xcel Energy Minnesota 2016 resource plan requirements) and energy efficiency, and require utilities to offer tariff-based inclusive financing to break down barriers to customer adoption
- Require utilities to engage in distribution system planning to accommodate solar and energy storage deployments (and electric vehicles) by doing a full value analysis of distributed energy resources, modeling to optimize distributed energy deployment, and designing appropriate policies (other ideas here)
- Require utilities to acquire energy storage, with an obligation to test multiple vendors and technologies, but allow customers access to the same rate structures or interconnection accommodations provided to utility-owned systems
Market-Targeted Recommendations
Because utilities retain enormous control of the electricity system in most states, preserving monopolies over the distributed grid or even vertical monopolies over the entire system, energy regulators and state legislatures must provide more opportunities for competitive access to energy solutions that don’t require monopoly control. Energy market rules can be affected primarily at the regional, state, and local levels. At the regional level, federal authorities write rules and recommendations for regional grid systems. Crucial rules for capturing the value of solar and energy storage include (many gleaned from FERC Order 841):
- Lowering thresholds for selling grid services into markets to 100 kilowatts
- Valuing both capacity and response speed in ancillary services markets to support system voltage and frequency
- Offering pricing and participation over short intervals to capture small movements in price
- Allow aggregated energy production and storage to participate in capacity, energy, and ancillary services markets, so that projects like the South Australia 50,000-home virtual power plant could capture value in U.S. markets.
State regulators and legislatures can also provide rules to improve access for solar and energy storage. Key rules include:
- Join 12 states (graded “A”) in adopting modern and streamlined interconnection rules for distributed energy resources.
- Adopt rules to allow energy storage to participate in net metering, as with rules under consideration or adopted in Massachusetts and Colorado.
- Join six other states in mandating utility purchase of energy storage from a variety of vendors, with a variety of technologies, and at a variety of scales.
- Establish transition funds for communities that host fossil fuel power plants likely to retire that address lost property tax revenue as well as labor retention, retraining, and retirement (see proposal for Diablo Canyon in California, community transition funds for a coal plant closure in Buffalo, New York; as well as worker transition ideas in this ILSR piece).
- Allow energy storage to “value stack” by capturing revenue for a variety of uses (examples below from Clean Energy Group).
Local officials can also enable solar and energy storage in several ways:
- Sponsor bulk purchasing programs for solar and energy storage, such as Boulder County, Colo., did with electric vehicles and solar panels.
- Invest in electric vehicle charging infrastructure and revise zoning and codes to accommodate charger deployment.
- Simplify permitting for distributed energy resources to avoid, for example, New York City’s effective murder of a virtual power plant project due to restrictive permitting for battery installation.
Procure energy storage for public facilities to test market opportunities, identify qualified contractors, and provide resilient power during grid outages at community buildings.
Conclusion
The combination of distributed energy storage and distributed solar is reversing the power flow, allowing customers and communities to generate most of their energy at home or nearby. It’s also reversing the political power in the system, enabling customers to evade most utility strategies for curtailing competition. In short, it’s a technology shift that enables energy democracy, where electric customers can––individually and collectively––have greater choice over the source and structure of their energy system.
But with much of the electricity system handed over to monopoly utility companies one hundred years ago, achieving energy democracy requires policy action.
Federal and state regulators must open markets to affordable distributed energy resources, and require any participant in markets (utilities or otherwise) to show that their infrastructure investments result in the most affordable energy and the greatest local economic benefit. State and local policy makers must adopt policies to allow communities to capture the economic opportunity from distributed energy resources, and rethink notion of utility monopolies in technology markets that are increasingly not. Local officials can also act, using public properties to demonstrate the value of distributed energy resources and enabling more residents and businesses to capture the value.
Energy storage is a 4th horseman to last century’s electricity system, providing a once-in-a-generation opportunity to rethink its structure. Technology has enabled a bottom-up revolution in power generation and management, and the question is whether policy makers will enable energy democracy or allow the incumbent energy monopolies to stand in the way.
Sources & Glossary
Sources:
- Average revenue per kilowatt-hour (not the same as electricity rates, and not factoring rate design elements such as fixed charges). Rate structures can matter a lot. One customer with a $100 per month electric bill may have a $40 fixed charge regardless of their energy use (or use of solar and energy storage) while another with the same total monthly cost may have a fixed charge as low as $10 (allowing solar and storage to do much more to reduce their energy bill).
- Using NREL System Advisor Model, default PVWatts model with property tax removed, 10 year loan term instead of 25 years, 5% interest rate, real discount rate of 2.5%. Costs include a 7-kWh Powerwall ($3,000) plus 5-kW solar array ($17,500) for a total cost of $20,500.
- Demand charges may be a poor reflection of actual grid costs if utilities assess fees on “non-coincident demand,” or energy use that does not coincide with the system-wide period of highest energy use.
- As with the first map, based on average residential utility revenue per customer, and not factoring in rate structures. A 5-kilowatt solar array combined with a 7-kilowatt-hour battery will cost $15,800, a levelized cost of 11.7¢ per kilowatt-hour. Calculated using NREL System Advisor Model, default PVWatts model with property tax removed, 10 year loan term instead of 25 years, real discount rate of 2.5%. Costs include a 7-kWh Powerwall ($1500) plus 5-kW solar array ($14,300) for a total cost of $15,800.
- A gas power plant on standby will be burning fuel, heating water, and making steam to spin its turbines but not be sending electricity to the grid. In other words, it’s incurring almost all operation costs but without generating any revenue.
- 100% electricity supply cost calculated by ILSR using Level10’s PPA 2018 PPA report and Berkeley Labs 2016 Utility-Scale Solar report for solar costs, and Energy Information Administration data on average wind capacity factors to estimate wind costs. In general, two-thirds of electricity was presumed to come the cheaper of the wind and solar resource. This annual average cost does not account for daily, monthly, or seasonal resource variation.
- Using a proxy of 30% of the average residential retail revenue per customer. See earlier chart on Cost of Delivered Electricity.
- Using NREL System Advisor Model with default settings for Commercial PV Watts unless otherwise noted. Solar resource for Oxnard, CA, airport; solar installed cost of $1.88 per Watt; battery cost of $175 per kWh; 100% debt for 10 years at 7% interest; real discount rate of 2.5%; 0% property tax. Note: lower costs could likely have been achieved with west-facing (rather than south-facing) solar panels to capture more peak-time sun.
- Economic data for Puente taken from the CPUC filing and Utility Dive. Economic data for solar and energy storage taken from the National Solar Jobs Census 2016 (jobs), Solar Energy Industries Association (installed costs), NREL System Advisor Model (levelized cost), Sunrun and GreentechMedia (operations local dollars).
- The four horsemen are described in Revelations in the Biblical New Testament, representing four major forces of a divine apocalypse: pestilence, war, famine, and death. They are often used in fictional works to illustrate the coming of apocalyptic change.
- The other business model threats are described in detail elsewhere, but included stalled electricity sales growth, the rise of competitive distributed solar, and distributed information technology like smart thermostats.
Ancillary services
Those services necessary to support a steady voltage and frequency of the transmission of electric power from where it is produced to where it is purchased. Such services maintain reliable operations of the interconnected transmission system. Ancillary services supplied with power generation include load following, reactive power-voltage regulation, system protective services, loss compensation service, system control, load dispatch services, and energy imbalance services. [1]
Baseload power generation unit
An electric power plant, or generating unit within a power plant, that is normally operated continuously to meet the base load of a utility; historically, powered by fossil fuel or nuclear energy sources. [2]
Commercial electricity demand charge
An additional electricity billing charge typically calculated by looking at the greatest amount of power (measured in kilowatts) needed by a consumer during “demand intervals” that make up a billing cycle. In most instances, a demand meter measures (and averages) the power “demand” in 15-minute time frames throughout the month and reports this information back to the electric utility. This reported peak-kilowatt level is then multiplied by a specific rate, which determining billed demand charges. [3]
“Coincident” demand charges only bill customers when their peak energy demand coincides with periods of peak energy use on the system at large.
Demand response
An automated or manual response by an electricity customer to reduce energy consumption when the utility asks. It can include an individual delaying when they wash clothes in response to a text alert, a factory shifting production to a different time of day, or air conditioners being cycled automatically by a utility on radio control to reduce demand.
Distributed Energy Resources (DER)
General or umbrella term for a variety of decentralized renewable energy technologies that enable consumers to produce or store electricity locally or even on-site. Common models of DER include but are not limited to solar Photovoltaic (PV) rooftop or ground-mounted arrays on residential and commercial properties, community solar gardens, and battery storage, which may or may not be grid-connected. The scale and ownership models of DER contrast with larger, utility-scale power generation sources that generally include centralized fossil fuel combustion or nuclear power plants connected to consumers through extensive transmission and distribution networks. DER may include energy reduction, as well, as through demand response.
Electric utility
All enterprises engaged in the production and/or distribution of electricity for use by the public, including incumbent and regulated investor-owned electric utility companies; cooperatively-owned electric utilities; and government-owned electric utilities (municipal systems, federal agencies, state projects, and public power districts). [4]
Home energy battery storage
Battery technology that enables storage of electricity produced on-site by solar PV arrays for residential customers. Existing storage technologies are currently made with one of three chemical compositions: lead acid, lithium ion, and saltwater. Storage capacity in kilowatt hours (kWh) among battery technologies vary. Many batteries for home energy storage are now designed to be “stackable,” which allows multiple batteries to be connected to a solar-plus-storage system to supply extra capacity. A battery’s power rating is the amount of electricity that a battery can deliver at one time, measured in kilowatts (kW). Commercially available, proprietary battery systems for home energy storage include but are not limited to the Tesla Powerwall, Sonnen eco, Sunrun Brightbox, LG Chem, and Pika Energy Harbor Smart Battery. [5]
Microgrid
Areas operating independently from the regulated electricity grid with technologies that include on-site power generation, smart electric devices, and energy storage, that are designed to maximize reliability and resilience. Places that have historically operated microgrids include military bases and hospitals, where reliable power is needed in the event of outages on the interconnected electrical grid. [6]
Net metering
A billing mechanism for electricity that credits owners of distributed energy systems for electricity produced, resulting in a “net” payment for electricity consumed or for electricity produced in excess of consumption. Generally used with small, on-site electric generators such as wind or solar energy.
When a customer-generator is both producing and consuming electricity at the same time, the laws of physics dictate that the electricity being produced flows to where it is being used (“net-zero” when producing the same amount of energy as is being used). But what about when electricity is being generated and none is being consumed? In these instances (“net-positive”) net metering allows customer/generators to spin their meter backwards, in effect paying the customer-generator the retail rate for the electricity that they generate but don’t immediately consume. If a customer generates more electricity than they consume over a period of time, they are typically paid for that net excess generation (NEG) at the electric utility’s avoided cost or its wholesale rate. [7]
Peaking power plant / peaking capacity
Generating equipment normally operated only during the hours of highest daily, weekly, or seasonal loads, historically reliant on fossil fuel sources of energy such as liquified gas. [8]
Virtual power plant
A cloud-based or Internet-connected network of decentralized power generating technologies such as heterogeneous DER, including wind farms and solar parks, as well as flexible power consumers and batteries. The interconnected units are dispatched through a central control room but nonetheless remain independent in their operation and ownership. A key objective of this model is to relieve the load on the grid by smartly distributing the power generated by individual units during periods of peak load. Such networks may also optimize trading and selling power on the open market. [9]
Sources for Glossary:
[1] Federal Energy Regulatory Commission (FERC). 2016. “Glossary.” URL: https://www.ferc.gov/market-oversight/guide/glossary. ILSR. 2017. “Report: Choosing the Electric Avenue – Unlocking Savings, Emissions Reductions, and Community Benefits of Electric Vehicles.” URL: https://ilsr.org/report-electric-vehicles
[2] FERC, op. cit.
[3] Sunpower. 2017. “A closer look at commercial electricity demand charges, and how to lower them.” URL: https://businessfeed.sunpower.com/articles/commercial-electricity-demand-charges
[4] FERC, op. cit.
[5] EnergySage. 2018. URLs: https://www.energysage.com/solar/solar-energy-storage/what-are-the-best-batteries-for-solar-panels & https://news.energysage.com/tesla-powerwall-vs-sonnen-eco-vs-lg-chem
[6] ILSR. “Microgrid Hotspot.” URL: https://ilsr.org/microgrids
[7] ILSR. 2011. “Net Metering.” URL: https://ilsr.org/rule/net-metering. SEIA. 2018. “Net Metering.” URL: https://www.seia.org/initiatives/net-metering
[8] FERC, op. cit.
[9] Yale Environment 360. 2016. “The New Green Grid: Utilities Deploy ‘Virtual Power Plants.’” URL: https://e360.yale.edu/features/virtual_power_plants_aliso_canyon. NEXT Kraftwerke. “Virtual Power Plant.” URL: https://www.next-kraftwerke.com/vpp/virtual-power-plant
This article originally posted at ilsr.org. For timely updates, follow John Farrell or Marie Donahue on Twitter or get the Energy Democracy weekly update. Also check out over 50 episodes of the Local Energy Rules podcast!
![]()
![]()
![]()
![]()