
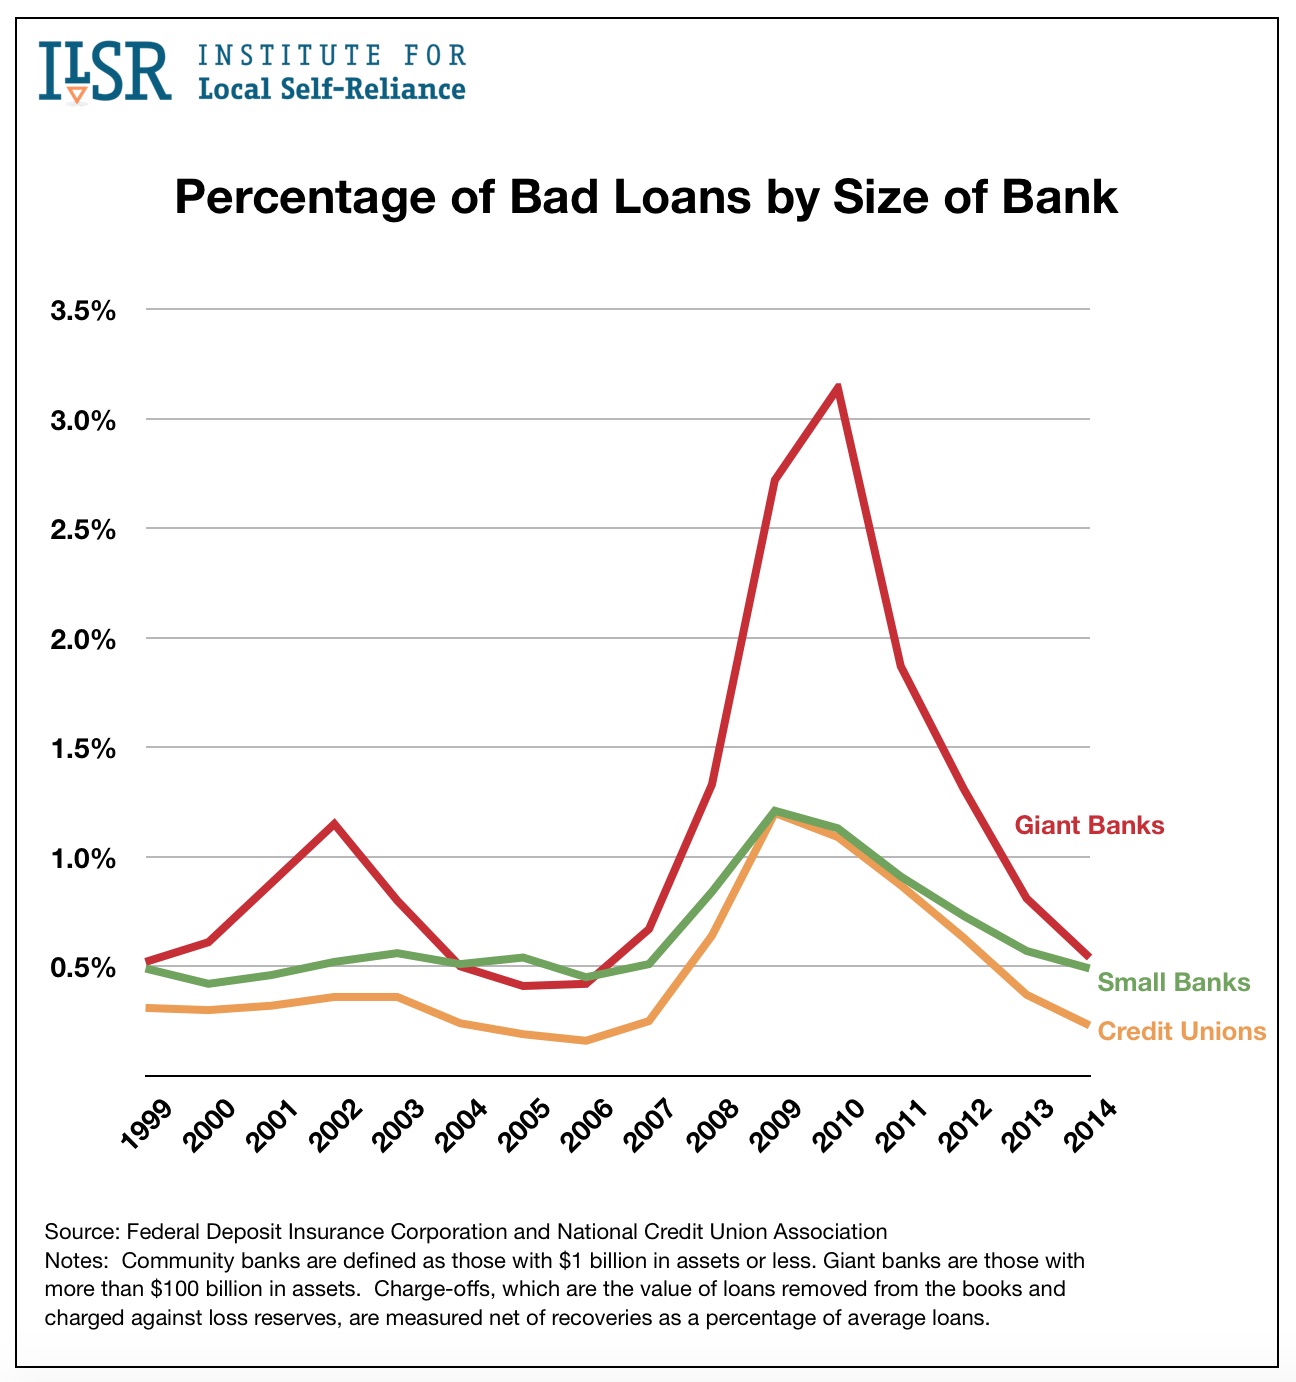
![]() Giant banks, defined as those with more than $100 billion in assets, consistently make poorer lending decisions and write-off more bad loans than do community banks, those financial institutions with under $1 billion in assets. The financial crisis heightened this trend, and in the years from 2008 to 2011, the share of bad loans made by giant banks spiked, while the share for small banks and community banks remained much more level.
Giant banks, defined as those with more than $100 billion in assets, consistently make poorer lending decisions and write-off more bad loans than do community banks, those financial institutions with under $1 billion in assets. The financial crisis heightened this trend, and in the years from 2008 to 2011, the share of bad loans made by giant banks spiked, while the share for small banks and community banks remained much more level.
![]()
![]()
![]()
![]()