
The third quarter of 2018 saw notable reductions in the growth and total capacity of new natural gas and utility-scale solar nationwide, but continued growth in distributed solar and wind power.
Roughly 5 gigawatts of new power generation came online across the U.S. in the third quarter of 2018, a decline of 54 percent, largely due to fewer new natural gas power plants compared to the second quarter of 2018.
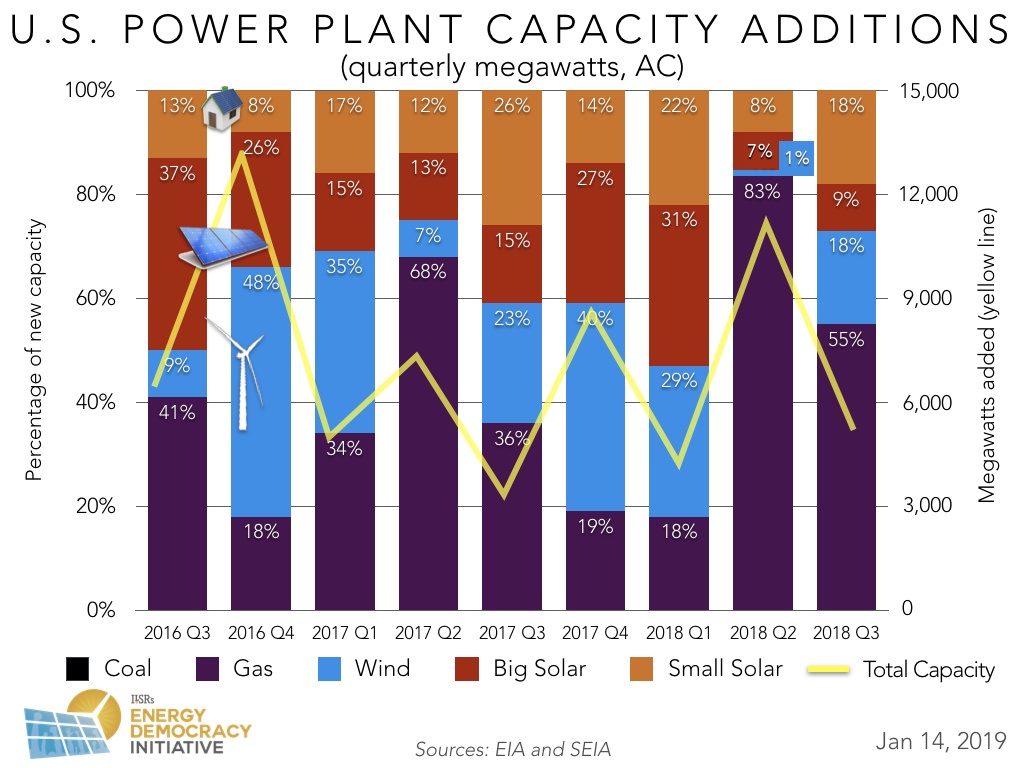
In the chart below, we illustrate the past several years of new power plant capacity in the U.S., disaggregated by energy source on a quarterly basis.
Contraction in New Natural Gas Plants and Utility-Scale Solar Growth
New natural gas plants claimed the largest share of new generation for the second consecutive quarter (2.8 GW or 55 percent of the total). However, less total capacity in natural gas was added compared to its previous peak — a whopping 9 GW of natural gas capacity came online in the second quarter of 2018.
The wave of gas plant construction continues despite potential liabilities for electric customers.. As we reported in comments to the Minnesota Public Utilities Commission late last year, natural gas price fluctuations have often been “sudden and severe” making these plants risky investments, while analysts have also pointed out worrying signs of a financial bubble associated with the natural gas sector.
In addition to decreased growth in new natural gas, utility-scale solar generation also saw a contraction, from roughly 800 MW in the second quarter to 472 MW. The Solar Energy Industries Association (SEIA) attributes this decrease to uncertainty in solar tariffs in late 2017 and early 2018.
Steady Distributed Solar Growth
Unlike drops in the number of new natural gas or utility-scale solar developments added, distributed solar continued to see growth this quarter. Residential and non-residential photovoltaic systems of less than 1 MW have averaged additions of about 900 megawatts (MW) per quarter since the beginning of 2018.
Explaining the success of distributed solar resources, SEIA cites community solar as a “significant share of non-residential growth” this quarter. Growth in shared renewables is will likely continue as new programs such as those being developed in New Jersey are finalized and existing programs mature.
In addition to distributed solar, new wind power also saw gains of over 900 MW or 18 percent of total new generation, a large increase from its record low performance in the second quarter, where only 150 MW were added.
The stabilization of distributed solar and other renewables such as wind power is an encouraging sign for cleaner, local power generation. We expect a continued shift in this direction in future quarters as solar plus storage becomes more cost competitive in a growing number of places, as more states, utilities, and cities make commitments to 100 percent renewable energy, and new financial institutions and financial models enable greater investment in these technologies.
Interested in earlier trends and analysis of new power plant capacity? Check out our archive, illustrating how electricity generation has changed in previous quarters and years.
This article originally posted at ilsr.org. For timely updates, follow John Farrell or Marie Donahue on Twitter or get the Energy Democracy weekly update.
Featured Photo Credits: Panchenks / Activ Solar / stantontcady / mdmarkus66 via Flickr (CC 2.0)
![]()
![]()
![]()
![]()