Yesterday we discussed the spread of solar carports in California, highlighting the Milpitas School District’s 14 distributed solar PV arrays. According to a news story, the district anticipates savings of $12 million over 25 years from the projects, which were financed by a power purchase agreement with Chevron Energy Solutions. But would the district have been better off owning their solar PV arrays rather than signing a power purchase agreement?
The answer is inextricably tied to the federal incentives for solar.
First, a little background on the district’s power purchase agreement with Chevron. The total cost of the 3.4 megawatt solar arrays was $30 million, for a cost of $8.82 per Watt (DC). Chevron paid for the entire installation and presumably used both the federal Investment Tax Credit and accelerated depreciation. Chevron also applied for and received the 5-year California Solar Initiative of 22 cents per kWh.
Since the school paid no money upfront, their contract with Chevron requires them to make annual payments for the solar power over 23 years. The first payment in 2009 was $856,000 and includes a guaranteed output of approximately 4 million kilowatt-hours (kWh) per year. In 2009, the difference between the district’s annual power payment to Chevron and its prior electric bill resulted in a savings of $51,000. The following chart from a district presentation illustrates the District’s anticipated savings (in green) over 25 years.
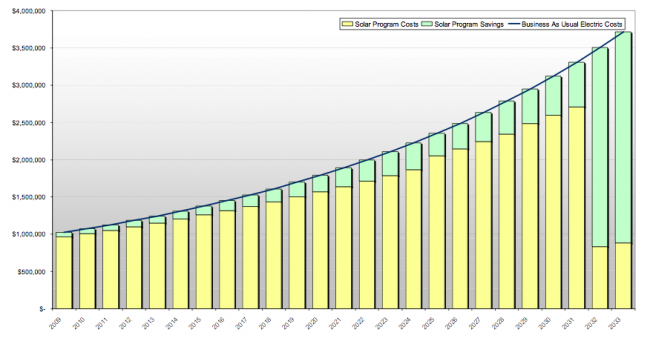
An analysis of the school’s contract and their 2009 savings suggests that the school was previously paying an average of 22.7 cents per kWh for the electricity replaced by the solar arrays. The contracted solar power was purchased at 21.4 cents, a savings of 1.3 cents per kWh. Because the contract price inflates at 3.75% per year, reaching a cumulative savings of $12 million over 25 years means that grid electricity prices will have to increase by approximately 5% annually for the school district to reach its savings target. (If electricity prices only increase at 3% annually, the 25-year savings would be only $2.6 million, almost entirely realized in years 24 and 25 when the district is no longer paying Chevron for the system).
So how does this power purchase agreement compare to owning the solar array?
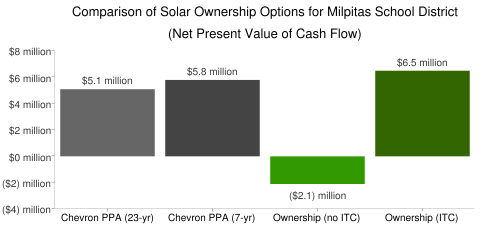
To construct and own the solar arrays, the district would likely have had to bond for the $30 million capital cost (we’ll assume they would issue a bond for 20 years at 4% interest). The school district could not use the federal Investment Tax Credit (as a non-taxable entity) so the its two sources of revenue would be the savings on district electricity bills and the California Solar Initiative production payment. Overall, ownership would have resulted in a net present value of -$2.1 million (5% discount rate) compared to the Chevron agreement’s net present value of $5.1 million.
However, the relative benefit of ownership is entirely the result of poor public policy.
If the federal Investment Tax Credit (ITC) was always a cash grant (as it has been since the passage of the 2009 stimulus bill), then the school could have received the 30% discount, just as Chevron did with the tax credit. The inclusion of the cash grant changes the net present value of solar ownership from -$2.1 million to +$6.5 million.
In other words, local ownership is more lucrative than third party ownership, but federal incentives make third party ownership the only fiscally reasonable option.
In lieu of ownership, the school has another option. The Chevron contract allows the school to buy out the contract in the 7th year (2015) for $15.6 million, just over half the cost of the system. Doing this makes sense, because the net present value of early buyout is $5.8 million, compared to the $5.1 million in the long-term contract. Even so, both options are less valuable to the school district than outright ownership if the school could use federal solar incentives.
The skew toward third party ownership is the result of dumb policy, and it ultimately increases transaction costs and the cost of solar to ratepayers. The Milpitas solar program is no exception.
Chevron’s cash flow from the project is quite handsome; the 7th-year buyout allows them to capture a pre-tax IRR of 50 percent. Even if Chevron can capture some minimal economies of scale in developing the project that the school district could not, these gains are overwhelmed by such a high rate of return.
| Year | Cash | Tax credit/MACRS | Debt Payments | CSI | District payments | Total |
| 0 | -$6,000,000 | -$6,000,000 | ||||
| 1 | $10,330,872 | ($3,496,462) | $880,000 | $856,000 | $8,570,410 | |
| 2 | $1,334,472 | ($3,496,462) | $880,000 | $888,100 | -$393,890 | |
| 3 | $1,334,472 | ($3,496,462) | $880,000 | $921,404 | -$360,586 | |
| 4 | $1,334,472 | ($3,496,462) | $880,000 | $955,956 | -$326,034 | |
| 5 | $1,334,472 | ($3,496,462) | $880,000 | $991,805 | -$290,185 | |
| 6 | ($3,496,462) | $1,028,997 | -$2,467,465 | |||
| 7 | $15,600,000 | $15,600,000 | ||||
| IRR | 50% |
Many schools, governments and other non-taxable entities look to solar power to provide electricity bill savings and electric bill predictability. Third party arrangements like the Milpitas power purchase agreement provide both, but at a premium to self-financed local ownership. Governments are used to making long-term investments with low returns, and federal renewable energy policy should support such investments for their ability to lower the cost of renewable power.
For more on the problems with federal renewable energy incentives and solutions, see Why Tax Credits Make Lousy Renewable Energy Policy.