Business
- Percent growth in corporate profits, 2001 through 2003: 62.2
- Percent growth in labor compensation, 2001 through 2003: 2.8
- Growth in private wage and salary income (total labor compensation, including health care and pension benefits), 2001 through 2003: -0.6
[Source: Economic Policy Institute, Economic Snapshots, May 27, 2004.]
|
Children and Families
- Percent of White children living in two parent homes in 1995: 75.8
- Percent of White children living in two parent homes in 2002: 74.5
[Source: United States Census Bureau. Table CH-2: Living Arrangements of White Children Under 18 Years Old: 1960 to Present. June 12, 2003]
- Percent of Hispanic children living in two parent homes in 1995: 62.9
- Percent of Hispanic children living in two parent homes in 2002: 65.1
[Source: United States Census Bureau. Table CH-4: Living Arrangements of Hispanic* Children Under 18 Years Old: 1970 to Present. June 12, 2003. *Persons of Hispanic origin may be of any race]
- Percent of African American children living in two-parent homes in 1995: 33.1
- Percent of African American children living in two-parent homes in 2000: 38.5
[Source: United States Census Bureau. Table CH-3: Living Arrangements of Black Children Under 18 Years Old: 1960 to Present. June 12, 2003. ]
|
|
Civic Engagement
- Number of hours of convention coverage each major party received on Al-Jazeera: 13
- Number of hours of convention coverage each major party received on ABC, NBC and CBS combined: 9 (three hours over three nights on each station)
[Source: San Francisco Chronicle, September 1, 2004. USA Today, August 31, 2004]
- Percentage of Americans living below the poverty level who voted in the 2000 presidential election: 38
- Percentage of Americans living at twice the poverty level who voted: 68
[Source: United States Census Bureau. “Reported Voting and Registration of Family Members, by Race, Hispanic Origin, and Family Income: November 2000”]
- Number of blank votes recorded by touchscreen machines in a January 2004 election for Florida’s House of Representatives: 137
- Number of votes by which the race was won: 12
[Source: George Bennett. “Loser Questions Use of Vote Machines”. Palm Beach Post. January 9, 2004.]
- Percentage of adults who feel that “politics and government are too difficult to understand”: 35
- Percentage of home educated adults who feel that “politics and government are too difficult to understand”: 4
[Source: Brian D. Ray, Ph.D. Home Educated and Now Adults: Their Community and Civic Involvement, Views About Homeschooling, and Other Traits. National Home Education Research Institute. October, 2003]
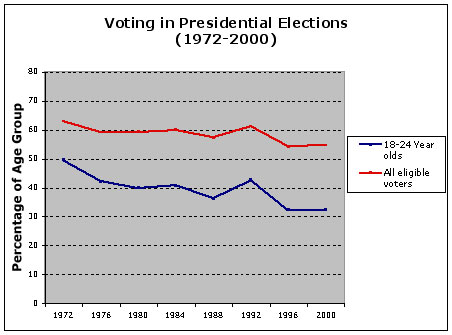
[Source: United States Census Bureau. “Reported Voting and Registration by Race, Hispanic Origin, Sex, and Age Groups: November 1964 to 2000.”]
|
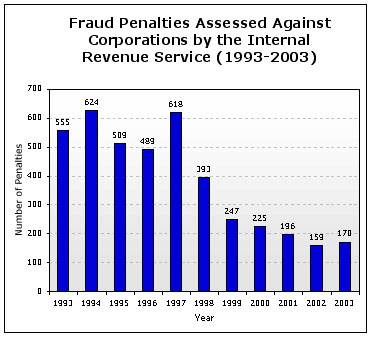
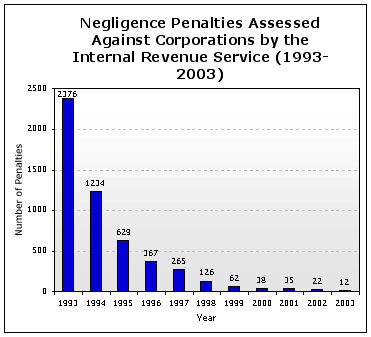
Crime and Punishment
- Number of defendants charged in U.S. district courts with firearm offenses in FY 1994 (second year of Clinton administration): 6,756
[Source:FY 1994: Federal Firearm Offenders, 1992-98: With Preliminary Data for 1999. Department of Justice. Office of Justice Programs. Bureau of Justice Statistics. June 2000. p. 2.]
- Number of defendants charged in U.S. district courts with firearm offenses in FY 2002 (second year of Bush administration): 10,634
[Source:FY 2002: Fact Sheet. “Project Safe Neighborhoods: America’s Network Against Gun Violence.” Department of Justice. Office of Justice Programs. February 7, 2003]
|
|
|
[Source: Transactional Records Access Clearinghouse (TRAC). Civil Penalties Assessed Against Corporations During the Last Decade. Syracuse University. 2003]
- Percentage of U.S. defendants who require a public defender: 80
[Source:Harper’s Index. March 2004. Also Steven B. Bright. Southern Center for Human Rights]
- Number of offenders in state/federal prison serving a life sentence in 1984: 34,000
- Number of offenders in state/federal prison serving a life sentence in 2003: 127,677
[Source:Marc Mauer, Ryan S. King & Malcolm C. Young. “The Meaning of ‘Life’ Long Prison Sentences in Context”. The Sentencing Project. May 2004.]
- Percentage of offenders in prison serving a life sentence doing so without chance of parole in 1992: 17.2
- Percentage of offenders in prison serving a life sentence doing so without chance of parole in 2003: 26.3
[Source:Marc Mauer, Ryan S. King & Malcolm C. Young. “The Meaning of ‘Life’ Long Prison Sentences in Context”. The Sentencing Project. May 2004.]
|
Education
- Percentage of average public university tuition covered by a maximum Pell Grant award in 1976: 84
- Percentage of average public university tuition covered by a maximum Pell Grant award in 2003: 39
[Source:State PIRGs’ Higher Education Project. Pell Grants.
Awarded on the basis on financial need primarily to undergraduates, the Federal Pell Grant, unlike a loan, does not have to be repaid. The major source of federal grant money for college, Pell Grants may be as large as $4050 per academic year.]
- A student from a family in the top 25 percent of income with standardized test scores in the lowest 25 percent was as likely to be enrolled in college as a student from a family in the lowest 25 percent of income earners with scores in the top 25 percent.
[Source:Lawrence E. Gladieux “Low-Income Student and the Affordability of Higher Education.” in Kahlenberg, Richard D., ed. America’s Untapped Resource: Low-Income Students in Higher Education. New York: The Century Foundation Press, 2004, p. 25.
Also, Harvard University press release. “Harvard Announces New Initiative Aimed at Economic Barriers to College”]
- Percent of students from families in the top 25 percent of income who graduate with a four-year degree within five years of entering college: 40
- Percent of students from families in the lowest quarter of income who graduate within five years: 6
[Source:Brian K.Fitzgerald & Jennifer A. Delaney “Educational Opportunity in America” in Heller, Donald E., ed. Condition of Access: Higher Education for Lower Income Students. Westport, CT: Praiger Publishers, 2002
Also, Harvard University press release. “Harvard Announces New Initiative Aimed at Economic Barriers to College”]
|
Energy
- Ratio of barrels of oil produced in US per day to barrels consumed in US per day during the Yom Kippur War of 1973: 1 to 1.3
- Ratio of barrels of oil produced in US per day to barrels consumed in US per day during the first Gulf War of 1991: 1 to 2.3
- Ratio of barrels of oil produced in US per day to barrels consumed in US per day during the second Gulf War in 2003: 1 to 3.7
[Source:Jim Snyder. Independence from foreign oil unlikely, analysts say. The Hill. July 28, 2004 and James L. Williams, et. al. The Coming Energy Crisis? WTRG Economics. February 3, 2003.]
- Average engine horsepower of a truck/SUV in 1980: 121
- Average engine horsepower of a truck/SUV in 2004: 235
- Average weight of a truck/SUV in 1980 (lbs.): 3868
- Average weight of a truck/SUV in 2004 (lbs.): 4712
[Source: Karl H. Hellman & Robert M. Heavenrich. Light-Duty Automotive Technology and Fuel Economy Trends: 1975 Through 2004. Advanced Technology Division, Office of Transportation and Air Quality, U.S. Environmental Protection Agency. April 2004.]
- Average engine horsepower of a car in 1980: 100
- Average engine horsepower of a car in 2004: 183
- Average weight of a car in 1980 (lbs.): 3101
- Average weight of a car in 2004 (lbs.): 3462
[Source: Karl H. Hellman & Robert M. Heavenrich. Light-Duty Automotive Technology and Fuel Economy Trends: 1975 Through 2004. Advanced Technology Division, Office of Transportation and Air Quality, U.S. Environmental Protection Agency. April 2004.]
- Maximum number of miles that Ford’s most fuel efficient 2003 car can drive on a gallon of gas: 36
- Maximum number of miles per gallon its 1912 Model T could drive: 35
[Source: Harper’s Index. September 2003. Also Ford Motor Company]
- Percentage of America’s oil supply imported in 1973: 35
- Percentage in 2002: 53
- Percentage of oil imported by US in 2001 that came from Persian Gulf countries: 23
[Source: United States Energy Information Administration. Net Oil Imports into United States by Origin (From OPEC and Persian Gulf Countries, Total Persian Gulf, Total OPEC, and Total World)]
|
Firearms
- Percentage of households that owned a gun during the Revolutionary War: less than 10
- Percentage of households that own at least one gun today: about 45
[Source: W.H. Frey, B. Abresch and J. Yeasting, America by the Numbers, The New Press, 2001.
lNRA-ILA, 2004 Firearms Facts ]
- Number of states that do not have the ability to access mental health records (including records of mental commitments) for purposes of a background check at the time of a firearms purchase: 14
- Number of states that do not have a reliable ability to check records for convictions for domestic violence: 22
- Number of states that do not forward all of their protection order information to the FBI for inclusion in the National Protection Order file: 15
[Source: Bureau of Justice Statistics, Survey of State Records Included in Presale Background Checks: Mental Health Records, Domestic Violence Records, and Restraining Orders in 2003, August 2004.] |
Government Accountability
- Number of documents classified in the first two years of Bill Clinton’s first term: 11 million
- Number of documents classified in the first two years of George W. Bush’s term: 44.5 million
[Source: Annual Report 2002, Information Security Oversight Office]
- Amount that federal money going to the average Democratic district exceeded that going to the average Republican district in 1995, the last year the Democrats controlled the budget process in the House: $35 million
- Amount that federal money going to the average Republican district exceeed that going to the average Democratic district in 2000, a year in which Republicans controlled the budget process: $612 million
[Source: Timothy Noah. Income Redistribution, GOP-Style. Slate. Aug. 6, 2002]
- Average salary of a state legislator last year: $30,300
[Source: Harper’s research. Harper’s Index. August 2003]
- Average amount spent lobbying one: $130,000
[Source: Robert Morlino and Leah Rush. “Hired Guns.” Center for Public Integrity. May 15, 2003] |
Homeland Security
- Number of English police guarding President Bush during state visit to London: 14,000
- [Source:”London Battens Down for Bush Visit: Large-Scale Anti-War Demonstrations Planned.” Washington Post. November 18, 2003]
- Number of Transportation Security Administration screener positions cut in 2003 due to federal budget cuts: 6,000
[Source: “No Impact on Security Passenger Wait Times as TSA Reduces Screener Jobs by 3,000.” U. S. Dept of Homeland Security. Transportation Security Administration. May 30, 2003 (This press release says 3,000, but an additional 3,000 were to be cut by the end of September)]
|
Knowledge
- Percentage of surveyed Americans who knew the verdict of the Martha Stewart trial: 79
- In the same survey, percentage who knew that Republicans have a majority in the U.S. House of Representatives: 56
[Source: Pew Research Center for People and the Press. Biennial News Consumption Survey. June 8, 2004.]
|
Labor
- Number of U.S. states that provide paid family leave: 1 (California, as of July 1, 2004)
- Number of countries in the world that provide paid maternity leave: 163
- Number that also provide paid paternity leave: 45
[Source: SJ Heymann, A. Earle, S. Simmons, S.M. Breslow, and A. Kuehnhoff. Work, Family, and Equity Index: Where Does the United States Stand Globally? Project on Global Working Families, Harvard School of Public Health. June 2004. ]
- Median weekly wage of full-time workers in 2003: $620 ($32,240 annually)
- Percent increase from 2002: 2
[Source: U.S. Department of Labor, Bureau of Labor Statistics Median weekly earnings of full-time wage and salary workers by selected characteristics.]
- Median annual compensation for CEOs of Fortune 500 companies in 2003: $4.6 million
- Percent increase from 2002: 27
[Source: Reuters. U.S. CEO pay rose 27 pct in 2003 — study. May 12, 2004.]
- Percentage increase in applications for disability payments from 1999 to 2003: 50
- Increase in number enrolled: 1 million
[Source: Austan Goolsbee. “The Index of Missing Economic Indicators;The Unemployment Myth.” New York Times. November 30, 2003]
- Peak unemployment rate in current recession adjusted to account for these uncounted and workless people: 8
[Source: Eileen Appelbaum, Annette Bernhardt & Richard J. Murnane, editors. Low-Wage America: How Employers Are Reshaping Opportunity in the Workplace. Russell Sage Foundation. Fall 2003]
|
Living
- Average square footage of a new house in 1970: 1,500
- Average square footage of a new house in 2000: 2,266
[Source: “While U.S. Houselholds Contract, Homes Expand.” Ameristat. March 2003
Also, US Census Bureau. “Median and Average Square Footage of Floor Area in New One-Family Houses Completed by Location.” Accessed May 25, 2004.]
- Average number of people per household in 1970: 3.14
- Average number of people per household in 2000: 2.62
[Source: “While U.S. Houselholds Contract, Homes Expand.” Ameristat. March 2003
Also, US Census Bureau. Table HH-4. Households by Size: 1960 to Present. June 12 2003.]
- The price of a life, according to the EPA, in 2000: $6.1 million
- The price of a life, according to the EPA, in 2002: $3.7 million
[Source: Jim Holt. “The Way We Live Now: The Human Factor.” The New York Times. 28 March 2004.]
|
Military
- Amount the Defense Department has lost track of, according to a 2000 report by its inspector general: $1,100,000,000,000
[Source: United States Department of Defense. Agency-Wide Financial Statements Audit Opinion. February 26, 2002. Page 2.]
- Ratio of this amount to rest of the world’s military budgets combined: 2:1
[Source: Congressional Research Service Report for Congress “Comparisons of U.S. and Foreign Military Spending: Data from Selected Public Sources.” January 28, 2004. ]
- Number of U.S. troops who have died in Iraq since May 1, 2003: 720 (as of 07/02/04)
[Source:Operation Iraqi Freedom (OIF) U.S. Casualty Status. United States Department of Defense. July 2, 2004.]
- Number who died in Vietnam in 1963 and 1964: 324
[Source: United States National Archives and Records Administration. “Reference Report #18: Statistical information about casualties of the Vietnam conflict.”] |
News Sources
- Of people who are regular viewers of the network nightly news, percentage who correctly answered four questions about current events: 33
- Percentage of regular viewers of the Daily Show who answered correctly: 47
[Source: Pew Research Center for People and the Press. Biennial News Consumption Survey. June 8, 2004.] |
Same-Sex Marriage
- Percentage of counties in the 2000 U.S. Census reporting same-sex couples raising children under 18: 96
- Percentage of counties in the 2000 U.S. Census reporting a senior citizen in a same-sex relationship: 97
- Percentage of counties in the 2000 U.S. Census reporting citizens in same-sex relationship: 99
[Source: Research Focus of the Urban Institute. Recent Findings.
“Since the U.S. Census Bureau asks no questions about sexual orientation or behavior, how do researchers identify gay men and lesbians? The Census form does ask about relationships between individuals in the household, including husband/wife, son/daughter, brother/sister, and so on. For the first time in 1990, the Census Bureau also added an “unmarried partner” category. If the person filling out the census form designates another adult of the same sex as his or her unmarried partner, the couple is counted as a same-sex unmarried partner household. Research strongly indicates that the same-sex unmarried pair identified by the census are, in fact, gay and lesbian couples.
The way data is edited once it’s collected changed in Census 2000 too. In 1990, when another adult of the same sex as the householder was identified as a “husband/wife,” the couple was counted as a heterosexual married couple. In 2000, the “husband/wife” was counted as an “unmarried partner.” Counting these same-sex married couples along with the same-sex unmarried partners helps explain the dramatic upsurge in the same-sex couple counts between 1990 and 2000. An even bigger factor may be the growing willingness of gay men and lesbians to identify themselves as partners.”]
|
Taxes
- Number of zero-tax* income tax filers in 2000: 29,900,000
- Zero-tax filers as percentage of all filers in 2000: 23.1%
- Estimated number of zero-tax income tax filers in 2004: 44,000,000
- Zero-tax filers as percentage of all filers in 2004: 33%
[Source:, Scott A. Hodge & J. Scott Moody. “The Growing Class of Americans Who Pay No Federal Income Taxes.” Fiscal Facts. Tax Foundation. April 14, 2004.
*The Tax Foundation defies zero-tax filers as those people filing income tax returns who, after taking all the available credits and deductions,will have all of the money withheld from their paychecks returned. Somemay even have moeny owed to them beyond withholding because of taxcredit programs such as child care credits or the Earned Income Tax Credit.]
- Tax deduction for businesses that buy a Hummer H2 that gets under 10 miles per gallon: $34,000
- Tax deduction for businesses that buy a hybrid car that gets 55 miles per gallon: $1,500
[Source: United States Department of Energy. Vehicle Buyers Guide for consumers]
- Number of years the new increase in the federal child tax credit is scheduled to last: 1
[Source: General Explanations of the Administration’s Fiscal Year 2005 Revenue Proposals. US Department of Treasury. February 2002. Page 2]
- Percentage of households that currently pay estate taxes: 2
- Percentage of value of estates worth more than $10 million that come from unrealized capital gains (e.g. appreciation of real estate or stocks or bonds): over 56
- Amount these estates are taxed on these gains: 0
[Source: Al Franken. Lies and the Lying Liars Who Tell Them:A Fair and Balanced Look at the Right. EP Dutton. 29 August, 2003. 2002]
- Percentage of Americans who will save less than $100 on their 2006 federal taxes as a result of the 2003 tax cut: 88
- Average amount (in dollars) these Americans will save: 4
[Source: Citizens for Tax Justice.“Most Taxpayers Get Little Help From Latest Bush Tax Plan.” May 30, 2003. ] |


 Which direction should you go? Find out what both sides are saying. Visit Issues and Allegations
 Need advice and counsel on politics and policies? Check the Ask Dr. Dave Archive.
 Crave a simple fact that sums up an attitude and tells a story? Visit Just the Facts