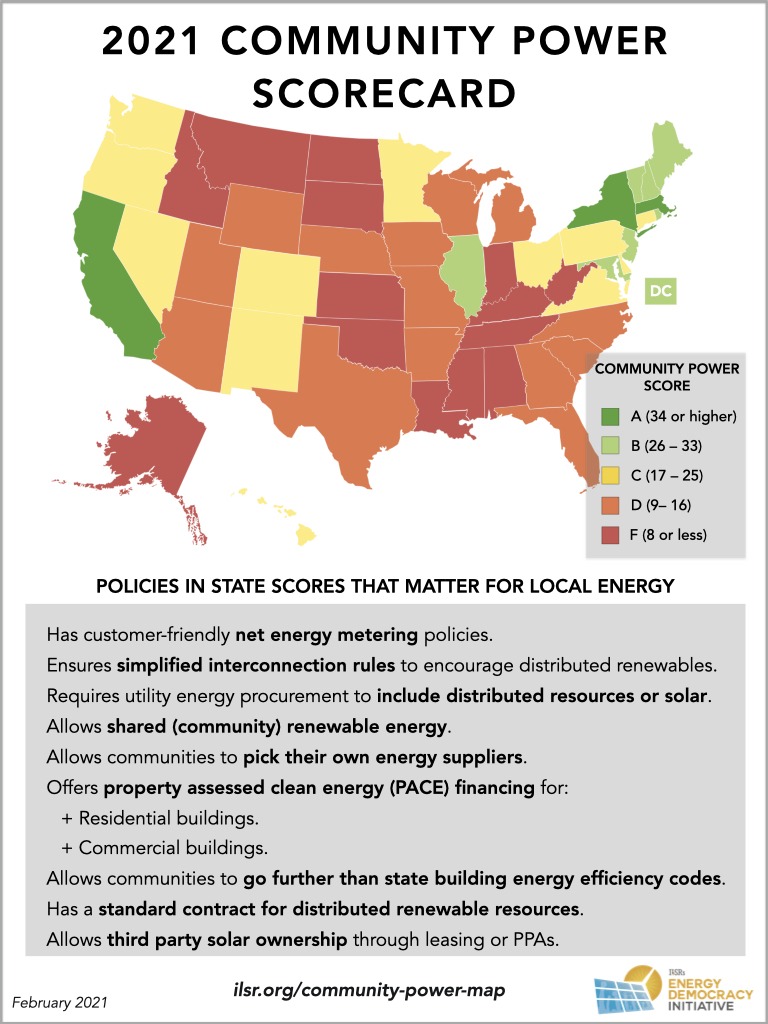
Each year, the Institute for Local Self-Reliance tracks and scores states based on their energy policies and how these policies help or hinder local clean energy action.
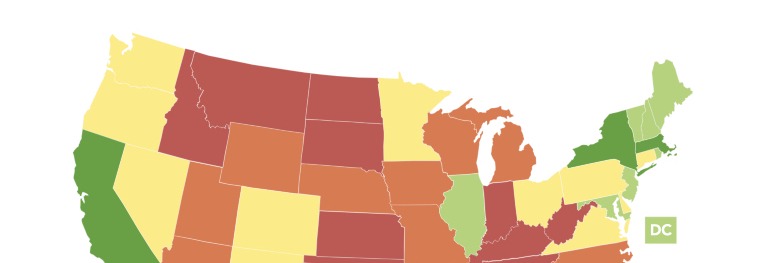
In the 2021 Community Power Scorecard, 3 states excelled, 8 states saw above average scores, 12 were average, 14 were mediocre, and 14 states received failing grades at enabling individuals and communities to take charge of their energy futures.
Scroll down to see the full 2021 results, read explanations of the policies scored, and share infographics on this year’s scorecard – including a list of the Top 5 and Bottom 5 states.
Details about our scoring methodology are available on our interactive Community Power Map.
Our scoring compiles data from the American Council for an Energy-Efficient Economy, DSIRE, the National Renewable Energy Laboratory, PACENation, Solar Reviews, and Vote Solar, as well as the data we regularly track on community solar, community choice aggregation, and state legislative changes in general.
States are awarded an A, B, C, D, or F letter grade. See the grading breakdown below:
![]()
Why these numbers?
- 0 to 19 percent is an F, 20 to 39% is a D, 40 to 59% is a C, 60 to 79% is a B, 80 to 100% is an A
In this iteration of our scorecard, we added a policy to our evaluation: policy allowing third party solar ownership. Third party ownership can be done through a power purchase agreement or leasing. Third party ownership removes many barriers to solar ownership, including steep upfront costs and inaccessible incentives, to ultimately promote distributed solar growth.
We awarded states two points for allowing third party ownership, one more point if that ownership can be done through a power purchase agreement, and one final point if power purchase agreements are allowed in all sectors.
The final change to our 2020 scoring applies to net metering. Solar Reviews (formerly SolarPowerRocks) is using a new, weighted grading system, so many states’ net metering scores have changed slightly from last year – without any corresponding policy change.
With the addition of four possible points for policy supporting third party solar ownership, the 2021 scores are evaluated out of a total of 42 points.
Read Energy Democracy Initiative Director John Farrell’s thoughts on Solar, Equity and Monopoly Power in 2021.
Last year’s scores are available in our 2020 Scorecard. Also see our companion pieces:
Community Power Scorecard – National Map
Community Power Scorecard – State-by-State Scores
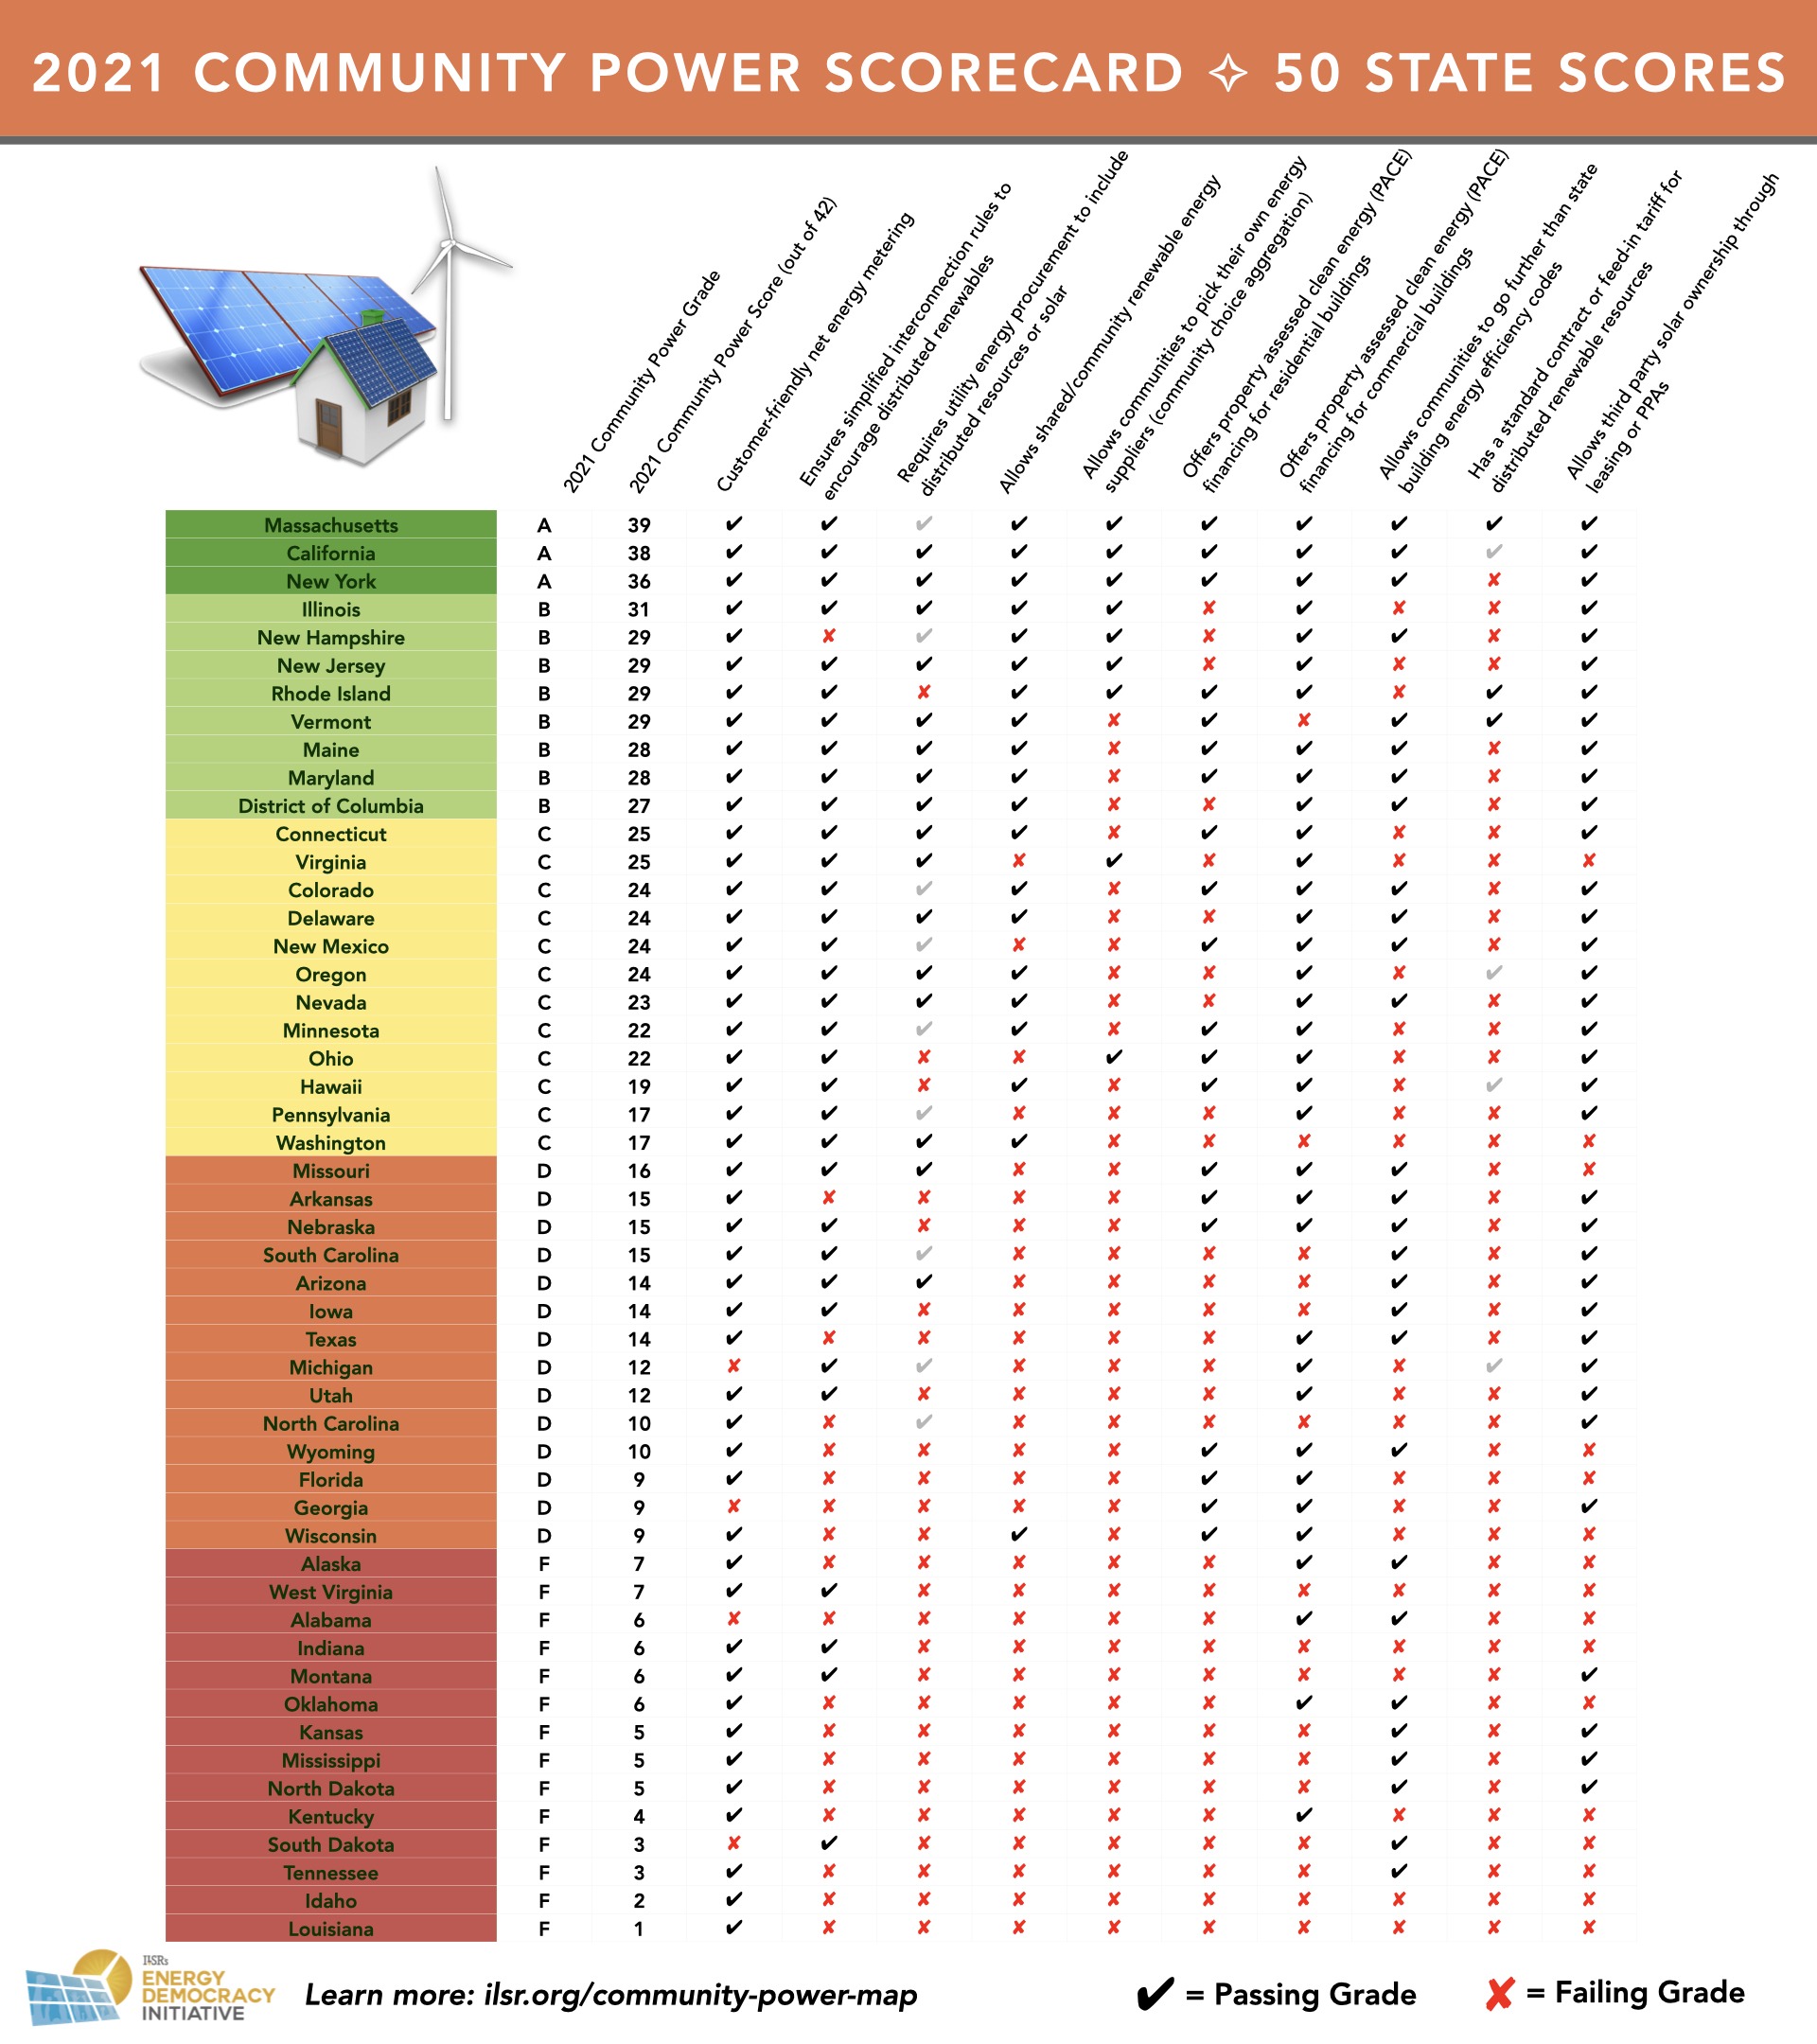
The full scorecard above shows the 10 individual policies and programs that states can use to enable local clean energy action.
See additional details on methodology by exploring our interactive Community Power Map.
For each factor, passing grades (represented by a black check) correspond to whether or not the state has an enabling policy and, in some cases, the quality of its policy or program (we consider individual policy grades of C or above to be passing). Conversely, mediocre and failing grades (illustrated by a red X) show that the state does not have that particular policy — or that its policy does not sufficiently support local clean energy. For the columns relating to renewable portfolio standards and feed-in tariffs, a grey check means that the state once had the policy, but it has expired.
The Top 5 States
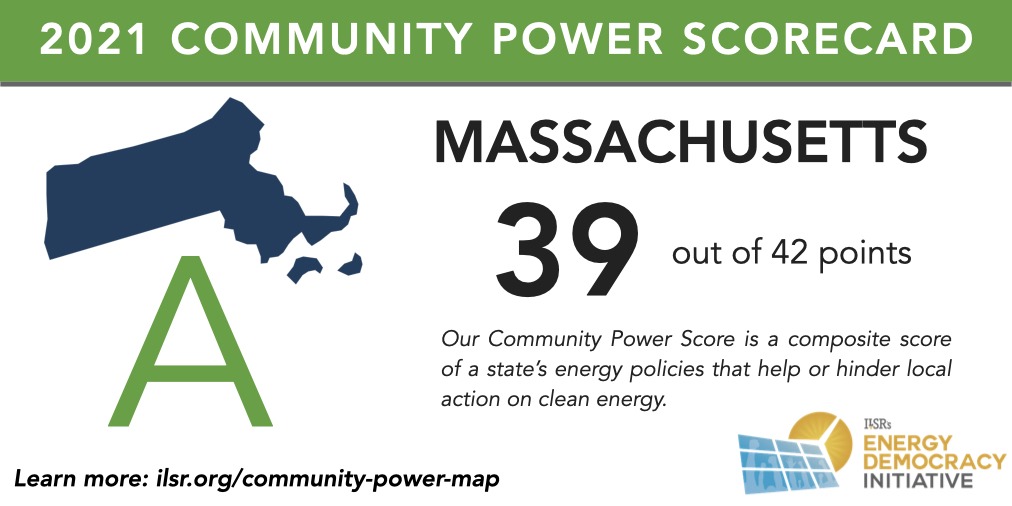
Massachusetts has a Community Power score of 39 out of 42. With this near-perfect score, Massachusetts communities have many policy options at their disposal to increase local power. The state scores big by allowing communities to choose their energy provider through community choice aggregation. Massachusetts gets perfect scores for its simplified interconnection and net metering policies. Local solar is further prioritized by the state’s renewable portfolio standard (RPS) solar carve-out and its standard contract program for distributed solar, called SMART. However, the solar carve-out of 1,600 megawatts expired in 2020, so the program only receives three points. Massachusetts also has a robust community solar program — although it misses just one point by not reaching our highest threshold for program capacity. Bay Staters have yet another route to solar access through third party solar ownership; Massachusetts allows leasing and power purchase agreements (PPAs) in all sectors. The state allows communities to finance energy improvements on both commercial and residential properties through Property Assessed Clean Energy (PACE). Finally, though Massachusetts has a state-set building energy code, communities are allowed to go further with stretch codes.
California has a Community Power score of 38 out of 42. Just behind leading state Massachusetts, California has received its first “A” grade on this year’s scorecard. The first community choice agency in the country was established in California. Accordingly, its many community choice agencies are trailblazers in driving community-focused policy. The state of California has a notable building energy code, with a requirement for solar on new homes, and communities are allowed to stretch this code further. The state also allows commercial and residential properties to become more energy efficient with the help of PACE financing. New this year, California earns five points for the unique customer-sited energy storage requirement in its 2018 renewable portfolio standard. California has a community solar program, but it has been slow to develop. Because of this, and since our metric takes state population into account, the state fails to earn points for community solar program efficacy. Californians can go solar through third party leasing or power purchase agreements, in all sectors. The state also scores full points on its interconnection and net metering grades. Finally, California earns reduced points for its Feed-in Tariff program, since it was suspended indefinitely.
New York has a Community Power score of 36 out of 42. The state has many policies that encourage local power and earns an “A” on this year’s scorecard. It misses one point on its interconnection policy, but collects all available points for net metering. New York not only has a robust building energy code, but it allows communities to go further by adopting stretch codes. The state also allows communities to establish PACE financing districts for commercial and residential building efficiency improvements. New York enables community choice aggregation. The program is growing rapidly, with many programs going further than necessary to source renewable energy for their customers. New York gets points for having a solar carve-out in its RPS, which was reinforced by 2019 legislative updates. The state does not have a feed-in tariff. New York allows electricity customers in all sectors to go solar through third party leasing and power purchase agreements. Last, but not least, New York has a fairly strong shared renewables policy, including its Solar for All program. While good in principle, the program fails to garner two shared renewables points for the program’s efficacy — which we measure relative to population.
Illinois has a Community Power score of 31 out of 42. The state is one of nine that allow community choice aggregation — a boost to both its score and the decision-making power of Illinois communities. Illinois gets full points for both its interconnection and net metering policies. Illinois has a community solar program that is just starting up, with the state awarding 215 MW of capacity as of April 2019. The program is anchored in 2018’s Future Energy Jobs Act. Distributed solar is also incentivized by the state’s renewable portfolio standard (RPS), which has a carve-out for distributed energy. Illinois allows third party solar ownership through leasing and power purchase agreements. The state does not allow communities to set higher standards than the state building energy code. It does, however, allow communities to set up PACE financing programs for commercial buildings. Finally, Illinois has never had a feed-in tariff.
New Hampshire, New Jersey, Rhode Island, and Vermont tie for fifth place with Community Power scores of 29 out of 42. New Hampshire, New Jersey, and Rhode Island all allow community choice aggregation – clearly a ticket to the top. Vermont makes up for these missed points with its standard offer program and with its renewable portfolio standard (RPS) carve-out, a policy which New Jersey shares. New Hampshire’s RPS carve-out has expired. Like Vermont, Rhode Island offers long-term solar contracts through its feed-in tariff. All four states have excellent net metering policies and allow third party solar ownership in all sectors. New Hampshire lags behind the pack with a failing interconnection grade. Rhode island allows both commercial and residential PACE financing, New Hampshire and New Jersey allow only commercial, and Vermont only allows residential. Each state has a budding community solar program. Finally, only New Hampshire and Vermont allow communities to stretch beyond the state-set building energy code.
The Bottom 5 States
Louisiana has a Community Power score of 1 out of 42. Louisiana used to have rules for interconnection and net metering, but eliminated them in 2019. Louisiana still gets 2 points for net metering (because it does not have a demand charge), but loses 2 points for interconnection. Notably, the state used to have a policy to provide financing for energy efficiency improvements, but repealed the measure in 2016. Louisiana scores its one, lonely point for having a state-set building energy code, which communities cannot make more stringent.
Idaho has a Community Power score of 2 out of 42. The state receives a failing grade because it has no policies requiring utilities to procure renewable energy, no financing for energy efficiency improvements in buildings, and very little opportunity for communities to procure or own renewable energy. The state gets one point for its state-set building energy code. Idaho has a net metering policy, for which it receives three points. However, this policy is one to watch: it was under attack in 2019. After the subtraction of two points for its retrograde interconnection policy, Idaho lands on a final score of 2 points.
Tennessee ties with South Dakota, with a Community Power Score of 3 out of 42. Tennessee scores points for allowing communities to set their own building energy codes and having some net metering, but loses two points for its lack of interconnection policy.
South Dakota ties with Tennessee, with a Community Power Score of 3 out of 42. South Dakota does not have net metering. However, unlike the others in the bottom five, the state does not lose points for interconnection. South Dakota only gets points for its locally-determined building energy code.
Kentucky has a Community Power score of 4 out of 42. Kentucky earns most of its points by allowing communities to establish PACE financing districts for building efficiency improvements. However, only commercial buildings can participate in Kentucky PACE. The state does score 2 points for net metering, but it loses those 2 points for poor interconnection standards. Kentucky earns its final point for having a state-set building energy code.
This article originally posted at ilsr.org. For timely updates, follow John Farrell on Twitter, our energy work on Facebook, or sign up to get the Energy Democracy weekly update.