Graphics from the report: Democratizing the Electricity System

Date: 20 Sep 2011 | posted in: Energy, Energy Self Reliant States | 0 Facebooktwitterredditmail

Update 9/20/11: Graphics marked with an * have been updated since the report’s release This page contains all of the charts, maps, and graphics from the new report, Democratizing the Electricity System: A Vision for the 21st Century Electric Grid. The graphics are in order of appearance in the main body of the report.  Charts are … Read More

Solar PV Economies of Scale Improve in 2010

Date: 15 Sep 2011 | posted in: Energy, Energy Self Reliant States | 0 Facebooktwitterredditmail

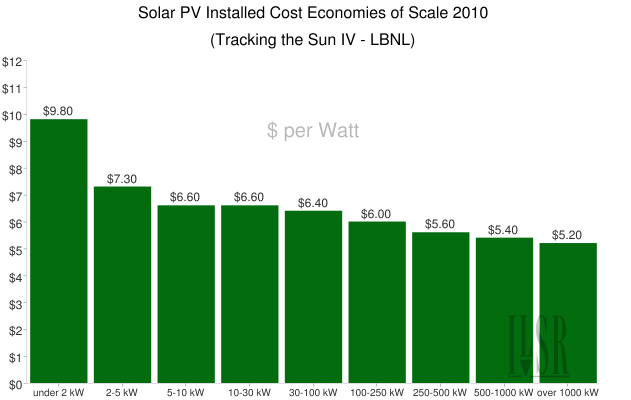
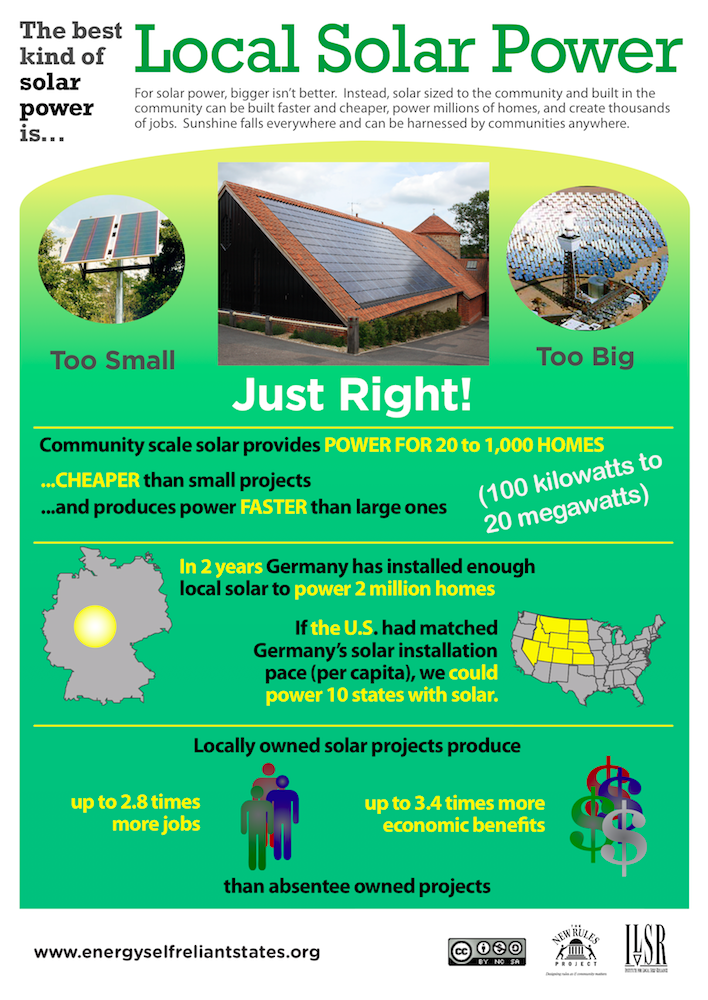
Installed costs for solar PV have dropped and economies of scale improved significantly in 2010, opening the door for much more cost-competitive distributed solar power. 

The data comes from the 4th edition of the excellent report from the Lawrence Berkeley Labs’, Tracking the Sun (pdf) and shows the installed costs for behind-the-meter solar PV projects in 2010.  The following merely copies Figure 11 from that report, showing the average installed cost of “behind-the-meter” solar projects in the U.S. in 2010, by project size.

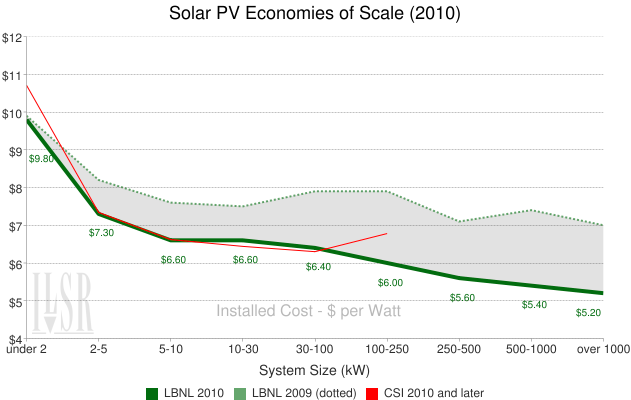
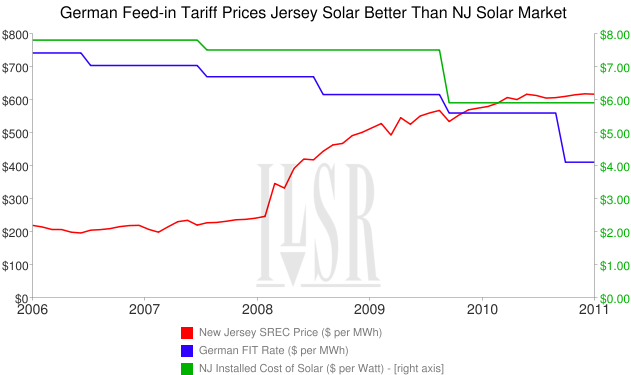
This is useful and shows the significant economies of scale for solar PV in 2010, but the history is important.  For context, the following chart shows the 2010 data along with the 2009 data from Lawrence Berkeley Labs, with the grey shaded area indicating the cost decreases.  The 2010 installed cost data from the California Solar Initiative (red) is also shown, helping validate the LBNL data.  The last data point from the CSI is an outlier likely due to having too few projects in that dataset.

Two things are clear from the new data.  First, installed costs have dropped significantly, by $1 per Watt for residential-scale solar PV and by nearly $2 per Watt for megawatt-scale projects.  We can also see more clearly how the economies of scale of solar have improved, as well.

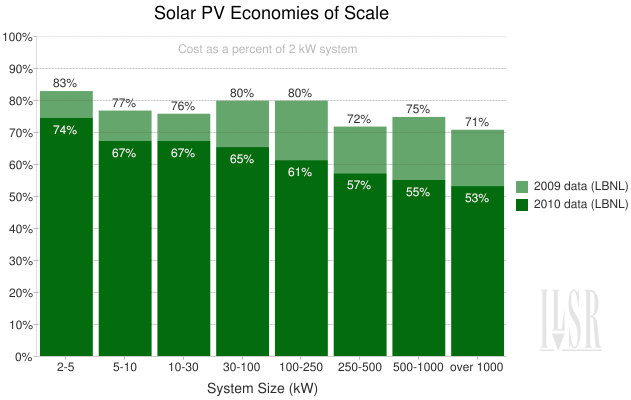
The unit cost savings between the smallest and largest solar projects (1 MW and under) jumped from $2.80 to $4.60 per Watt, a change in relative savings from 30 percent to 47 percent.  Economies of scale were also much greater for mid-size solar (30-100 kW), with the percentage savings over the smallest projects rising from 21 to 35 percent.   The following chart illustrates the change in economies of scale, showing installed costs as a percentage of the cost of a 2 kW system.

Instead of having relatively little economies of scale for solar PV projects larger than 2 kW, the 2010 data confirms that the unit cost of solar does continue to fall significantly as solar projects grow up to 1 megwatt (MW) in size.

Unfortunately, LBNL did not have sufficient data to provide context for economies of scale for larger distributed solar projects (1 to 20 MW), with only about 20 datapoints.  However, their finding was that these larger crystalline solar projects cost between $4 and $5 per Watt, showing small but significant scale economies.

The lesson is that solar economies of scale seem to be improving as the U.S. market matures, good news for distributed solar to compete with peak electricity prices on the grid.

[note: for more context, see the previous post on 2009 solar economies of scale]

Read More

Severe Volatility Illustrates the Risks of Using Solar RECs

Date: 8 Sep 2011 | posted in: Energy, Energy Self Reliant States | 0 Facebooktwitterredditmail

This is a little taste of a project I’m doing comparing solar renewable energy credits (SRECs) with a state solar mandate to Clean Contracts (a.k.a. feed-in tariffs).  One metric for comparison is the risk created by market uncertainty, and there’s no better illustration of the risk and uncertainty in SREC markets that this chart.  In the … Read More

PACE Financing: A 101 and Status Update

Date: 6 Sep 2011 | posted in: Energy, Energy Self Reliant States | 1 Facebooktwitterredditmail

A short slide deck providing a “101” on Property Assessed Clean Energy (PACE) financing, a status update on the legal challenges, and some of the policy design issues we explored in our report on Municipal Financing Lessons Learned.

Read More

Putting the Sun to Work for Minnesota

Date: 2 Sep 2011 | posted in: Energy, Energy Self Reliant States | 1 Facebooktwitterredditmail

This is the best video you will ever see supporting a state solar energy standard, submitted for a contest hosted by Environment Minnesota.


For more information on the solar energy standard for Minnesota, see Environment Minnesota’s website as well as Solar Works for MN.

Read More

PACE Financing Takes a Step Forward in Court

Date: 1 Sep 2011 | posted in: Energy, Energy Self Reliant States | 0 Facebooktwitterredditmail

With a ruling that the Federal Housing Finance Agency (FHFA) must do a formal rulemaking on its 2010 decision to torpedo the innovative local finance tool for energy efficiency and clean energy retrofits, a federal judge gave Property Assessed Clean Energy (PACE) financing new life.

Earlier this year, it looked as if prospects were bleak for PACE in 2011, with some progress on Commercial PACE and a new director at advocacy organization PACENOW, but agonizingly slow steps on federal legislation and litigation. 

Today’s ruling means FHFA has to start over, but it does not overturn the agency’s 2010 advisory against PACE, leaving the program in limbo until the formal rulemaking is complete.  Here’s hoping PACE finally wins through, a great tool for saving energy and creating jobs at the local level.

Read More

Clean, Local Power for Kentucky

Date: 31 Aug 2011 | posted in: Energy, Energy Self Reliant States | 0 Facebooktwitterredditmail

In August 2011, ILSR Senior Researcher John Farrell gave this presentation to a group of rural utilities and environmental organizations in Kentucky.  The slides illustrate the enormous renewable energy potential in Kentucky and the cost-effectiveness of clean, local power in meeting the state’s electricity and economic needs. Clean Local Power for Kentucky from John Farrell

Why ‘Market-based” is a Poor Criteria for Good Solar Policy

Date: 25 Aug 2011 | posted in: Energy, Energy Self Reliant States | 1 Facebooktwitterredditmail

Updated 8/26/11 and 9/1/11

Many renewable energy advocates argue that the market for solar renewable energy credits (SRECs) is a more cost-effective tool for incentivizing solar power than a feed-in tariff (or CLEAN contract) set in a regulatory proceeding. 

Really?

This chart illustrates the installed cost of solar in New Jersey from 2006 to 2011 (as reported by the National Renewable Energy Laboratory in Tracking the Sun III and converted to levelized cost) in green, the New Jersey SREC spot market price in red, and the German feed-in tariff price (constant exchange rate, adjusted for NJ solar insolation) for rooftop solar projects 30 kilowatts and smaller in blue. (Update 9/1: the previous chart showing solar cost in $ per Watt is here).

Does a “market-based” policy do a better job of matching the actual cost of solar? 

This comes to mind: “one of these things is not like the other…”

Update 8/26: I should add that the German feed-in tariff is the only source of revenue for solar projects, whereas the SREC in New Jersey comes in addition to the federal 30% tax credit and accelerated depreciation (and net metering).  Since the two federal incentives (and net metering values) have not changed, the fact that the SREC value is rising against the tide of falling solar prices is even more absurd.

Read More

1 55 56 57 58 59 60 61 115